The New England natural gas market has been subjected to winter price spikes for over a decade, and this trend appears likely to persist. Throughout most of the year, there is adequate natural gas pipeline capacity to serve regional gas demand. However, pipeline capacity is insufficient to meet peak gas demand during the coldest winter weeks which leads to price spikes. Since natural gas-fired generation comprises a significant portion of the New England Independent System Operator’s (ISO-NE) generating capacity, this pricing dynamic also has significant impacts on ISO-NE energy prices, fuel mix, and reliability.
In 2015, two competing projects were proposed to alleviate New England’s winter pipeline constraints:
Tennessee Gas Pipeline Company’s Northeast Direct Project (NED) and,
Algonquin Gas Transmission’s Access Northeast Project
Neither project was ultimately constructed. At the time of pre-filing with the Federal Energy Regulatory Commission (FERC), both projects had a proposed in-service date of November 2018. Given the region’s susceptibility to gas price spikes during peak demand periods, it is reasonable to ask the following question. If either of the projects had been completed, what would have been the impacts on New England’s energy markets?
New natural gas pipeline projects are often reliant on long-term contracts from their shippers in order to receive both approval from FERC and to secure project financing. The NED and Access Northeast projects were highly contingent on long-term contracts with utilities. This dependency was highlighted in the August 2016 case of the Conservation Law Foundation v. the Department of Public Utilities presented before the Massachusetts Supreme Judicial court. The court ruled that electric utilities could not pass the cost of pipeline tariffs on to their customers,1 and subsequently, the pipeline developers for NED and Access Northeast withdrew their applications. There has, however, been continued discussion among pipeline developers to re-examine the Access Northeast project.2
Algonquin Gas Transmission is one of the most important natural gas pipelines in New England and serves customers from the New Jersey-Pennsylvania border through Boston, MA. The proposed Access Northeast Project consisted of upgrades to the existing Algonquin pipeline system and to construct a liquefied natural gas (LNG) storage facility in New England. The combined upgrades would be capable of delivering up to 925 million cubic feet per day (MMcf/d) of natural gas during peak periods.3 The LNG facility was intended to operate as a peaking system – the pipeline component of the project would deliver feed-gas to the LNG facility for liquefaction during off-peak demand periods and the LNG facility would then deliver vaporized natural gas during peak periods. Used in this manner, the facility would reduce the required pipeline capacity from approximately 925 MMcfd to 450 MMcfd.
Tennessee Gas Pipeline is an 11,750-mile pipeline that spans from south Texas to Boston. Zones 4, 5, and 6 of the pipeline are used to transport natural gas from the Marcellus and Utica shale formations in the Appalachian basin to customers in the northeastern U.S. The NED project was comprised of a “Market Path Component” with 1.3 billion cubic feet per day (Bcf/d) of natural gas transportation capacity and a “Supply Path Component” with 1.2 Bcf/d of capacity. At the time of NED Project application with FERC, the company had secured long-term contracts totaling just over 500 MMcf/d of capacity.4
If either of the projects had been completed, what would have been the impacts on New England’s energy markets? Three distinct scenarios were created using RBAC’s GPCM® Natural Gas Market Forecasting System™ to answer this question:
- The first scenario is our 19Q4base release which does not include either Access Northeast or NED.
- The second scenario, “Access Northeast” is identical to 19Q4base except the Access Northeast project has been modeled in the scenario with an in-service date of November 2018.
- The third scenario, “NED” is identical to the 19Q4base except the NED project has been modeled in the scenario with an in-service date of November 2018.
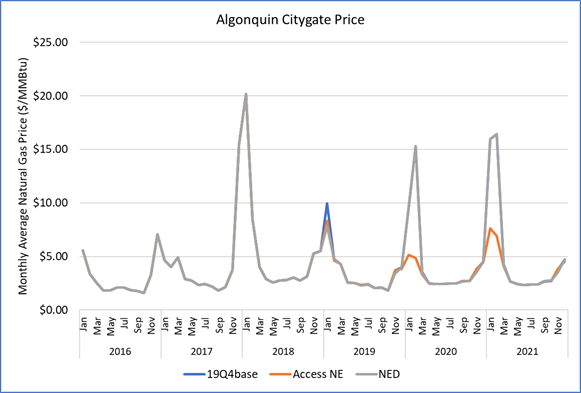
The results of the scenarios are stark. The Access Northeast Project would have greatly reduced winter price spikes at Algonquin Citygate, a key natural gas pricing point for the Boston area. During 2019, modeled January and February prices would have averaged $0.89/MMBtu lower had Access Northeast entered service while 2020 prices were forecasted to be $7.42/MMBtu lower; and 2021 prices $8.94/MMBtu lower. Modeled January and February prices from 2019-2021 are on average $5.75/MMBtu lower with Access Northeast in service starting November 2018.
Figure 1: Algonquin Citygate Price Under Three Infrastructure Scenarios
The NED project’s price impact would have primarily been experienced at Tennessee Gas Pipeline Zone 6, delivered (TGP Z6), which is another major New England natural gas pricing point. The simulated peak month impacts are most prominent during the month of January. During January 2019 prices would have been reduced by $3.36/MMBtu; 2020 prices reduced by $2.29/MMBtu; and forecasted 2021 prices by $2.68/MMBtu. The 2019-2021 simulation produced January prices that were on average $2.78/MMBtu lower during the month of January with the NED Project than without.
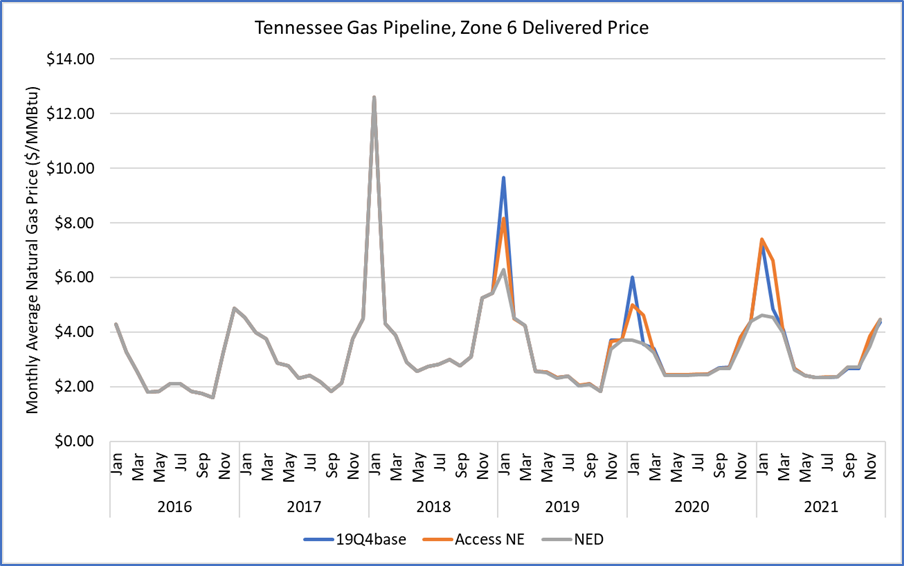
Figure 2: TGP Z6 Prices Under Three Infrastructure Scenarios
The impact on the natural gas markets are only half of the story. New England’s electricity markets have also become highly dependent on natural gas. Natural gas-fired generation produced 31% of electricity in New England in 2008, but by 2018 accounted for 49%. Despite significant additions to gas-fired generation capacity in New England during recent years, there have not been any major natural gas pipeline projects completed in the region since the Algonquin Incremental Market Expansion in 2016. To complicate matters, there have been numerous retirements of non-gas generation plants in the region. Like most regions, New England electricity demand peaks during the summer months to serve air conditioning load, while in contrast natural gas demand peaks during the winter months to serve heating load. There is adequate pipeline capacity to serve gas-fired generation during the summer months when overall natural gas demand is lower. However, during very cold winter periods, there is insufficient pipeline capacity to serve both gas-fired generation and heating load. Heating load is served by local distribution companies, which hold a greater share of the firm transportation contracts in New England, entitling them highest priority to use pipeline capacity.
As a result, New England’s fuel mix changes substantially during cold weather. ISO-NE relies on dual-fired generators that burn fuel oil in order to maintain electric reliability. Relative to natural gas, fuel oil produces significantly more carbon emissions as well as more air-pollutants such as NOx and SOx.
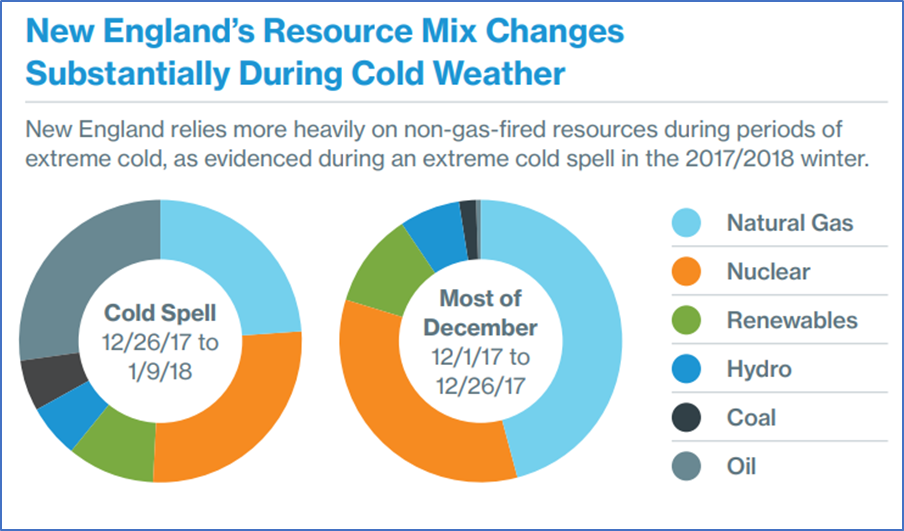
Source: https://www.iso-ne.com/static-assets/documents/2019/12/isone-2019-2020-winter-outlook.pdf
According to the Independent Market Monitor of ISO-NE, the total wholesale cost of electricity in 2018 was $12.1 billion.5 At $6 billion, energy costs accounted for half of the 2018 cost of delivering electricity. Since natural-gas fired generators are frequently the marginal units, they tend to set the market price of electricity thus making energy costs in ISO-NE highly dependent on the price of natural gas. The average monthly natural gas price measured at Algonquin Citygate and the average monthly day-ahead locational marginal price (LMP) of electricity for the Boston area have a correlation of 99%. Real-time LMPs, both peak and off-peak, also share high correlation with the wholesale gas price, but over 97% of the cost of energy was settled on day-ahead prices in 2018.
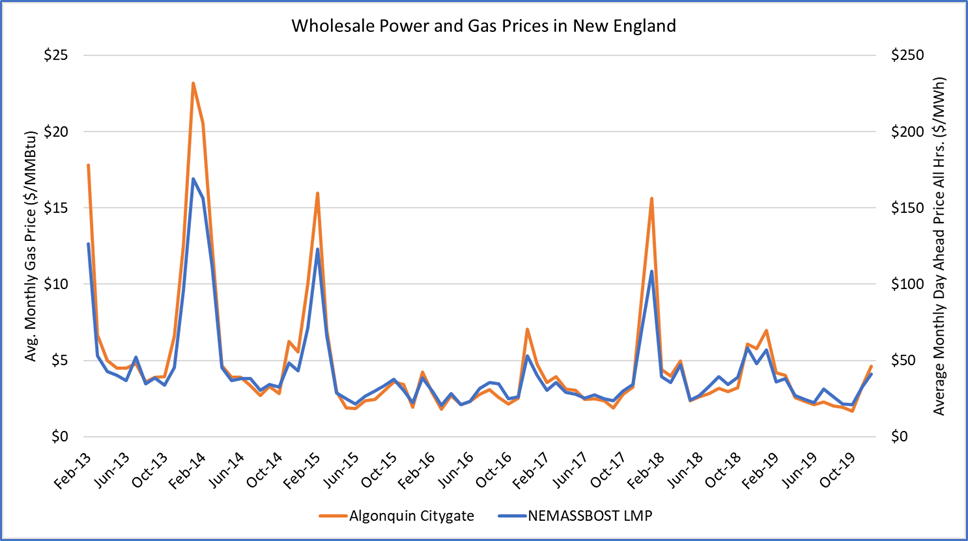
Figure 3: Relationship Between Wholesale New England Power and Gas Prices
Source: Platts Gas Daily (monthly avg.) and ISO-NE Monthly LMP Indices
It is not a coincidence that wholesale electricity prices differ from natural gas prices by a factor of ten. The market heat rate in ISO-NE, a measure of the efficiency of the marginal generator, is approximately 10 MMBtu per megawatt-hour (MW-hr.). Although electricity markets are highly complex systems, it is possible to calculate a rough approximation of the electricity savings resulting from lower natural gas prices since the price of electricity and natural gas in the region are highly correlated. Note that during January and February, natural gas prices spike relatively higher than power prices. During periods when gas becomes scarce and expensive, it is more economic to use fuel oil instead of natural gas to generate power.
For the purposes of a rough estimate, assume that natural gas prices will set the price of the electricity since prices would be significantly lower with the Access Northeast Project. Price reductions at Algonquin Citygate would likely have the greatest impact on ISO-NE energy prices since over half of gas-fired generation capacity in the ISO is connected to the Algonquin pipeline. The Access Northeast GPCM scenario shows that the project would reduce January and February prices by an average of $5.75/MMBtu during the time period 2019-2021. With gas-fired generation setting the wholesale price of electricity, this would translate to wholesale electricity price savings of approximately $57.50/MW-hr. during the months of January and February — $5.75/MMBtu * 10 MMBtu/MW-hr. — in addition to the emissions avoided by substituting natural gas for fuel oil during peak winter generation periods.
The total energy savings for consumers from such a price reduction could be very large. During the months of January and February from 2018-2020, the New England states consumed approximately 98.3 Bcf of natural gas per month. A price reduction of $5.75/MMBtu applied to that volume of gas would equate to approximately $565 million dollars. Similarly, ISO-NE’s Net Energy for Load averaged 10,409 GW-hr. for the same months. A price reduction of $57.50/MW-hr. would equate to over $598 million dollars. The peaking nature of this problem complicates the analysis, but this approximation suggests that New England customers would save $1.1 billion for every monthly gas and power price spike avoided by Access Northeast — not bad for a project with an estimated total cost of approximately $3 billion. While this number might seem surprisingly large, other analyses performed five years ago predicted similar cost savings.6
Using the GPCM system users are able to simulate future market outcomes based on their own set of assumptions, but can also “back-test” market responses to forgone infrastructure projects, environmental and policy regulations enacted, and other potential market impacting events. The above analysis focused on the market impacts of forgone infrastructure and clearly shows that the opportunity costs can be quite dramatic, not just for heating demand loads (primarily residential and commercial demand) but also gas-fired power generation demand and thus electricity prices.
Quantifying the full-cycle (environmental, economic and social welfare) cost/benefit analyses is imperative to optimizing local, state, regional, and overall national socioeconomic benefits. As you can see from this article, hindsight is 20/20. This demonstrates the vital necessity to have the ability to run multiple scenarios, using the GPCM Natural Gas Market Forecasting System, to better understand the potential risks and opportunities around any project for any Resource Planning process.
1) “Massachusetts high court nixes ‘pipeline tax’, electric utilities may not finance major natural gas projects”, Mass Live, August 17,2016. <https://www.masslive.com/politics/2016/08/states_highest_court_strikes_d.html>
2) “Eversource seeks to revive New England Access Northeast natgas pipe”, Reuters, June 11, 2018. <https://www.reuters.com/article/us-eversource-natgas-access-northeast-pi/eversource-seeks-to-revive-new-england-access-northeast-natgas-pipe-idUSKBN1J72K5>
3) See FERC Docket No. PF16-1
4) See FERC Docket No. CP16-21-000
5) 2018 Annual Markets Report, ISO New England Inc., Internal Market Monitor, Published May 23, 2019. < https://www.iso-ne.com/static-assets/documents/2019/05/2018-annual-markets-report.pdf>
6) Access Northeast Project – Reliability Benefits and Energy Cost Savings to New England. Prepared by ICF International, February 18, 2015. <https://www.puc.nh.gov/Electric/Wholesale%20Investigation/Eversource/Attachment%2016%20-%2015-124%20Eversource%20Comments%20-%20ICF%20on%20AccessNE%2002-18-2015.pdf#page=33&zoom=100,92,96>