By Cyrus Brooks, RBAC, Inc.
Pre-History
Natural gas was first piped over distances for use in ancient China around 500 BC. So, there’s a little prehistory to our natural gas system in the United states which I wrote about and you can read it here if you are interested.
But this article is about the development of the modern U.S. natural gas market. This history is not only fascinating but necessary for understanding why the U.S. natural gas market is the way it is and how its development into today’s structure impacts everyone from investors and traders to producers and distributors. Even those in related fields such as power generation, AI, data centers, finance, and crypto, will find these insights crucial. If you’re ready for the full story, read on.
The Real Beginning of the U.S. Natural Gas Market
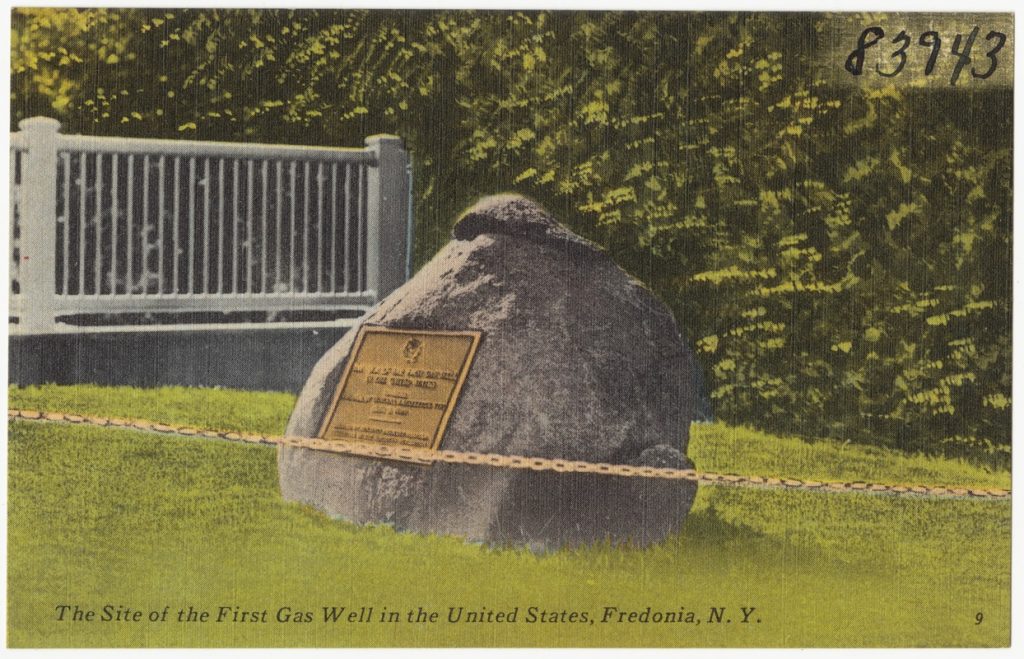
The modern market could be said to start when modern transmission really begins: 1891, with the first major long-distance natural gas pipelines being completed.
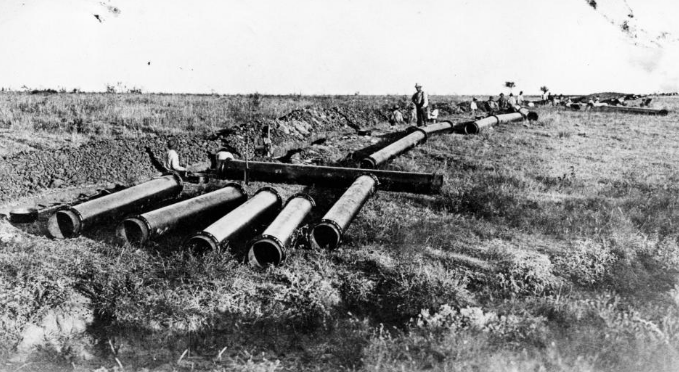
Before this, you had to live right near the production source to use natural gas because the lack of long-haul pipelines. But with new technology, better sealing methods and early compression and using wrought-iron pipes, they successfully laid two 8-inch pipes side by side and transported gas from Indiana to Chicago, covering roughly 120 miles. It was the first time gas was being moved not just across a town, but across a region to a “distant” market.[1]
Section 1 — From Regional to National Pipelines (1891–1938)
The 1891 line from central Indiana to Chicago is often cited as one of the first long-haul gas pipelines: early, inefficient, and historically important mostly because it demonstrated what the industry wanted to do next, move supply to distant demand centers.
But the system didn’t become national overnight. For the next few decades, pipelines expanded slowly and most connected nearby gas fields to nearby cities, still facing leaks and needing better compression.
At the same time, cities were already using coal gas for lighting and heating. Natural gas was cleaner and often cheaper, but it could only replace coal gas if pipelines could reach the city.
Technology would change that in the 1920s with the arrival of welded pipelines, making them stronger, allowing higher pressure, both of which made longer distances possible. And this was confirmed in 1925 with the first all‑welded pipeline, over 200 miles, laid from Louisiana to Texas.
After that, pipelines began connecting production regions to distant cities and crossing state lines. Expansion accelerated and the massive buildout of U.S. natural gas pipelines started to look like an interconnected network instead of isolated local lines. Advances in high-tensile steel pipe and electric welding allowed for the first 1,000-mile lines (like the Natural Gas Pipeline Co. of America’s line from Texas to Chicago in 1931).[2]
Welding technology and continued demand for natural gas changed long-distance gas transmission from a “pipe dream” to “pipeline reality”.
Section 2 — Regulation Begins (1938–1954)
The Natural Gas Act
The immense pipeline expansion introduced a significant structural problem: pipelines are incredibly capital-intensive to build, and once a route is established, it often becomes the only practical “corridor” between two regions.
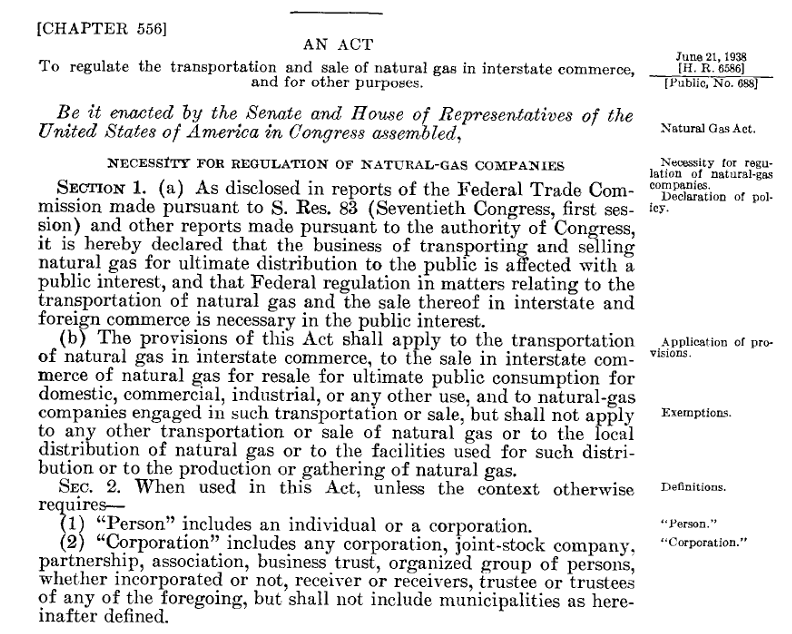
This created a natural monopoly, where a single provider dominated because duplicating such expensive infrastructure was inefficient. By the 1930s, entire regions had become dependent on these single routes. This captive market dynamic gave pipeline owners immense power to control prices, ultimately leading to federal oversight established by the Natural Gas Act of 1938.
The Natural Gas Act mandated interstate pipeline services are required to be “just and reasonable,” and it established the legal basis for federal oversight of interstate transportation and wholesale sales for resale.[3]
The Federal Power Commission (FPC) was designated to take on the new task of regulating interstate natural gas pipelines and sales (The FPC was actually created earlier, by the Federal Water Power Act of 1920, to take responsibility for hydroelectric projects). The FPC would later become FERC in 1977.
In practical terms, the FPC used cost-of-service ratemaking: rates were designed around the cost of providing service plus a reasonable return. Also notable is they would grant “Certificate of Public Convenience and Necessity” to build a major interstate pipelines, after the company requesting it could show the project is needed and serves the public interest.[4]
In many respects, this regulatory era “worked” by replacing market volatility with a predictable, steady expansion. Demand grew consistently, pipelines expanded in coordinated phases, and the Federal Power Commission (FPC) provided oversight through rate policing and facility certification.
However, an imbalance was developing. Producing regions sought to maintain a free market at the wellhead, while consuming areas pushed for the Federal Power Commission (FPC) to control prices at both the source and during transit. While the Natural Gas Act of 1938 explicitly regulated shipping but not production, a loophole emerged: companies that both drilled and shipped could circumvent rate caps by inflating wellhead prices while lowering transportation costs.
This friction was intensified by the market’s lopsided geometry. On one end, the sector was fragmented, with over 5,000 independent drillers competing for discoveries. On the other, the midstream was remarkably concentrated. By the early 1950s, just 20 to 30 large companies controlled the majority of supply and gathering systems, and only five interstate pipelines—including the Natural Gas Pipeline Company of America—served as the primary corridors to national markets. This concentration of power, combined with the ability of pipeline owners to drill their own supply, created a regulatory gray area that forced a high-stakes re-evaluation of the law.
Section 3 — Well Head Pricing and Unintended Consequences (1954-1970s)
The regulatory stability of the early era was upended in 1954 by the Phillips Petroleum Co. v. Wisconsin decision, ruling that federal price controls extend all the way to the wellhead.[5]
After the 1954 Phillips decision forced the Federal Power Commission (FPC) to regulate natural‑gas wellhead prices, the agency applied traditional cost‑of‑service ratemaking to thousands of individual producers. But with over a thousand separate rate cases per year—1,265 applications in 1959 alone, of which the FPC could handle barely one‑fifth—the system collapsed under the administrative burden. In 1960, the FPC shifted to area pricing, dividing the country into five producing regions and setting uniform ceiling prices for each, but determining “just and reasonable” regional rates proved so slow and complex that by 1970 only two regions had finalized rates, leaving most prices effectively frozen at 1959 levels. By 1974, area pricing was deemed unworkable, and the FPC replaced it with a single national price ceiling of $0.42 per mcf—higher than 1960s levels but still far below market value. This national cap would remain until Congress acted in the late 1970s. But the problems created in this period went far beyond administrative disputes over pricing; they began reshaping the entire supply‑and‑demand balance of the natural gas market.
The System Locks Up – Gas Shortages
Because the federal wellhead price controls starting in 1954 kept interstate natural gas prices far below their true market value, this created a widening imbalance between supply and demand over the next two decades.
As postwar industry expanded, suburbanization grew, and home heating spread, this cheap gas encouraged heavy consumption; this trend only intensified when the 1973–74 OPEC oil crisis arrived, making natural gas even more attractive.
However, those low-price ceilings gave producers little incentive to drill or develop new reserves, since the cost of finding gas was unpredictable while the selling price was fixed and artificially low.
At the same time, the FPC regulated only interstate gas, leaving intrastate markets free to pay much higher prices. As a result, producers increasingly kept their best reserves inside their own states; intrastate dedicated reserves grew from about one third in 1965 to nearly one half by 1975, starving interstate pipelines of supply. Though producing states (e.g. Texas, Louisiana, Oklahoma) were fine with their intrastate pipelines, consuming states (e.g. Midwest, Northeast, East Coast) to were in trouble.
With pipeline contracts rigid, prices fixed, and production lagging, the interstate system began to seize up. By the early and mid-1970s, winter shortages forced factories to close, new customers were refused service, and industrial users were routinely curtailed so residential heating could be prioritized.
The system was simply too inflexible, demand rising, supply held back, and prices locked in place. Something had to change to get gas flowing again.
Section 4 — Solving Gas in Crisis: Early System Modeling (1975)
It was becoming increasingly clear that federal wellhead controls had pushed the natural gas market into a full‑scale supply crisis that could no longer be managed under the existing regulatory framework.
In 1975, right in the middle of this shortage era, MIT PhD candidate Robert E. Brooks, completed his Operations Research dissertation, aptly titled, “Allocation of Natural Gas In Times Of Shortage: A Mathematical Programming Model of the Production, Transmission, and Demand for Natural Gas under Federal Power Commission Regulation”. Within it, Dr. Brooks[6] asked a fundamental question:
What is the system actually doing?
His work led to the development of GASNET—a mathematical programming model designed to represent the U.S. natural gas system as it actually operated:
- Production fields with varying costs
- Pipelines with physical capacity limits
- Regional demand centers with competing priorities
- All with the overlay of Federal Power Commission regulation
Instead of treating the market as two simple supply and demand curves, Brooks posited supply, demand, and a network with constraints, then treated allocation as an optimization problem.
The difference sounds subtle, but the ramifications are not. Shortages aren’t just “not enough gas.” They can be the result of:
- Pipeline bottlenecks
- Contractual rigidities
- Regulatory price distortions
- Or simply the inability to move gas to where it’s needed, when it’s needed
The system could be adequate in total supply, and be unbalanced locally, thus explaining: winter curtailments, regional price dislocations, and persistent basis differences.[7]
With this pivotal modeling, Dr. Brooks shed light on how the entire system operated, (and the GASNET model foreshadowed even greater modeling software and a reprise of Dr. Brooks’ study of the network).
As Dr. Brooks demonstrated, a system built on controlled prices and rigid flows could not adjust to market shifts, making shortages an expected outcome rather than an anomaly. This reality would be starkly proven over the next three years as the interstate system spiraled into even greater crisis.
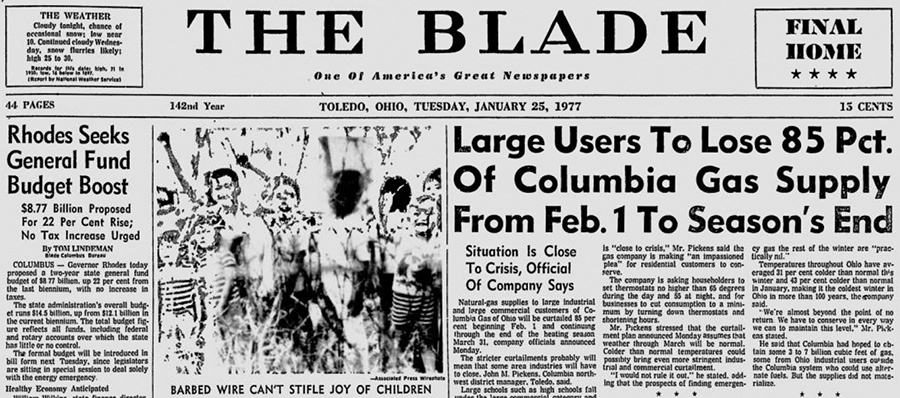
Severe Winter Freezes and Gas Crisis
By the winter of 1975–76, industrial shortages had reached 23% of firm requirements, triggering over 400,000 layoffs across the Mid-Atlantic and Southeast.[8] Though the FPC attempted to spur production in 1976 by tripling the national gas rate to $1.42 per mcf,[9] the move was immediately mired in court challenges, stalling new drilling just as the “Great Freeze” of 1977 arrived. This catastrophic winter caused a near total system collapse in states like Ohio and New York, where gas became so scarce that even high-priority schools and hospitals faced shut-offs, famously forcing Columbus, Ohio, to broadcast lessons over the radio.[10] To fix the problems of the 1970s, the U.S. had to change direction.[11]
And the first part to unlocking the rigidity of the system was deregulation.
Section 5 — Deregulation & Restructuring (1978–1992)
With natural gas shortages hitting not only industrial users but the broader public by the late 1970s, there was strong pressure for change. Instead of relying on strict price controls, policymakers began shifting toward a system where prices could guide supply and demand—while pipelines remained regulated as infrastructure.[12] The first major step was the Natural Gas Policy Act of 1978.[13]
It began loosening price controls at the wellhead. Prices rose, production increased, and over time the most severe shortages eased. But as Dr. Brooks’ work showed, pricing was only part of the problem.
Pipelines still controlled both buying and moving gas. And as natural monopolies, pipelines could favor their own gas over others. Additionally, during the shortage years, they had signed long-term contracts to secure supply, often at increased prices. But as demand softened, those contracts became a problem. Supply was tied up in long-term take-or-pay contracts (agreements requiring pipelines to pay for gas whether they used it or not) and could not easily adjust to changing demand. So the next phase focused on changing the structure of the market itself.
In 1985, FERC introduced Order 436. Pipelines could now move gas they didn’t own, and customers could buy gas from other suppliers and have it transported through the pipeline. This became known as open access—allowing multiple parties to use the same pipeline system.
This change was driven in part by the fact that many customers were trying to avoid higher-priced pipeline gas tied to those long-term contracts. By allowing transportation-only service, Order 436 gave buyers more flexibility to source cheaper gas elsewhere, though it created financial strain for pipelines still bound to those contracts and led them into legal disputes with producers.[14]
Open access also contributed to the emergence of natural gas marketers, who began connecting producers and buyers across the system.
In 1989, the Natural Gas Wellhead Decontrol Act completed the move away from price controls by removing the remaining federal limits on wellhead prices. This meant that going forward, the market—not regulation—set the price of natural gas at its source.
Then in 1992, FERC Order 636 completed the restructuring.[15] Pipelines were required to unbundle their services, spinning off their sales arms into separate marketing affiliates; as a result, pipelines effectively stopped selling gas and transitioned into transportation-only providers.
The change was massive. Now, instead of pipelines directing flows, many players were involved:
- Producers selling gas directly
- Utilities and large users buying it
- Marketers arranging transactions
The same physical network—but now control of gas was spread across the market. And that changed what it meant when stakeholders say, “we need a new pipeline.”
Before, pipeline companies identified demand, secured supply, and signed long-term bundled contracts that supported financing. After restructuring, pipelines became transporters. They no longer control the gas or the deals.
Instead, to determine whether a pipeline project can be financed, pipelines now rely on market participants—such as utilities (local distribution companies or LDCs), producers, and marketers—to commit to firm transportation. These commitments are driven, in part, by basis, which signals whether moving gas creates value. As more participants entered the market, the price signals for moving gas were only going to grow stronger.
In Part 2, we’ll see how trading, price signals, and open access made the gas market far more dynamic and interconnected.
Would you like a demonstration of RBAC’s market simulation tools? Click here for a demo or to contact us for more information.
RBAC, Inc. has been the leading provider of market fundamental analysis tools used by the energy industry and related government agencies for over two decades. The GPCM® Market Simulator for North American Gas and LNG™ is the most widely used natural gas market modeling system in North America. RBAC’s G2M2® Market Simulator for Global Gas and LNG™ has been instrumental in understanding evolving global gas and LNG dynamics and is vital in fully understanding the interrelationship between the North American and global gas markets.
[1] EIA Energy timelines Natural Gas
[2] Natural Gas Pipeline Company of America
[4] FERC Cost-of-Service Rates Manual
[5] Phillips Petroleum Co. v. Wisconsin
[7] Allocation of Natural Gas in Time of Shortage, Dr. Robert Brooks
[8] Natural Gas Legislation Remarks at a News Briefing on the Legislation
[9] The Second National Natural Gas Rate Cases
[10] Remembering the 1977 Gas Shortage
[12] The History of Regulation NaturalGas.org
[13] Natural Gas Policy Act of 1978
[14] Natural Gas Regulation: Pipeline Transportation Under FERC