
If Part 1 describes why demand for natural gas is accelerating from multiple directions at once, Part 2 addresses the dynamics to the infrastructure equation and whether it can realistically keep up.
A 3D Chessboard
As outlined in part 1, AI Load, LNG Demand and Infrastructure have created three-dimensional dynamic:
- AI Data Centers – Large, fast-growing clusters needing 24/7 firm capacity.
- LNG Export Terminals – Fixed, long-term feedgas demand tied to global markets.
- Infrastructure – Gas Turbine backlogs, interconnection queues, and regional gas-pipeline constraints.
Not So Fast! Connecting to the Power Grid
What are interconnection queues?
Utilities and regional grid operators (a.k.a., ISOs or RTOs) require projects seeking to connect to the grid to undergo a series of studies before they can be built. This process establishes what new grid system upgrades may be needed before a project can connect to the system and then estimates and assigns the costs of that equipment. The lists of projects that have applied to connect to the grid and initiated this study process are known as “interconnection queues”. – LBNL
Lawrence Berkeley National Laboratory (LBNL) documented how U.S. interconnection queues have grown to an unprecedented scale in their report: Queued Up: 2025 Edition. Here are four key takeaways:
- Roughly 2,290 GW of capacity was actively seeking interconnection in 2024 (1,400 GW of generation and 890 GW of storage). While total queue volume declined year-over-year, natural gas capacity increased by 72%, even as solar (-12%), storage (-13%), and wind (-26%) fell.
- The typical project built in 2024 spent 55 months in interconnection queues, up from 36 months in 2015 and 22 months in 2008, raising concerns about meeting growing electricity demand and resource adequacy needs.
- More than 70% of interconnection requests are withdrawn, and only 13% of capacity submitted between 2000 and 2019 had reached commercial operation as of the end of 2024.
- Completion rates vary significantly by technology; by capacity, hydro (30%), nuclear (21%), and natural gas (17%) have the highest average completion rates.
These queues were not designed to accommodate large, fast-arriving, location-specific loads such as 300–1,000 MW data center campuses. So, what are data center developers doing about this?
How Data Centers Are Adapting: Behind-the-Meter Gas and Hybrid Systems
With long delays for large (and even smaller) gas turbines and grid interconnection, hyperscalers (loosely defined as large data centers for Big Tech or others) are moving directly into power development. We are seeing such solutions as:
- Behind-the-meter (BTM) gas power
- Hybrid gas + battery microgrids
- Acquisition of existing power plants and interconnection rights
- Long-term nuclear PPAs
And even quite creative workarounds such as retired nuclear submarine powerplants and repurposed aircraft engines.
But a real and large example to illustrate how these projects are making things work:
“Oracle and OpenAI’s next big AI bet for Project Stargate … will be powered by hundreds of natural gas generators, bypassing the strained U.S. power grid so it can come online faster.”
This approach bypasses interconnection queues and turbine backlogs by relying on smaller modular turbines or large reciprocating engines. It also pushes natural-gas demand directly into local pockets, making modeling regional gas-balances vital to planners, investors and basically all industry participants.
Temper Temper, Are these Data Center Projections Real?
At the same time, it is important to recognize that the highest-case projections for data center growth assume a largely unconstrained environment, one where transmission buildout, land-use approvals, water availability, local opposition, and power-system integration challenges do not materially slow development. RBAC’s analysis of Virginia data centers (explained further below) clearly shows that the most aggressive growth scenarios represent an upper bound rather than a base case. In reality, infrastructure limits, regulatory friction, and community resistance are likely to temper the pace of expansion, even if long-term demand remains strong.
The community backlash to data centers due to their local impact on the living environment is significant and echoes the challenges run into by midstream companies building pipelines or even expansions or compressor stations.
“AWS has withdrawn plans for a 7.2 million-square-foot data center — which would have been one of the world’s largest — in Louisa County, Va., after neighbors voiced concerns about its potential impact.”
And though the race for supremacy in AI is global and has real momentum, the competition for power will also threaten a rise in prices for local consumers (and perhaps some local industry) and all this will concern politicians and those who approve projects.
“The bottom line about electricity prices is that we are facing a situation of demand outpacing supply, causing prices to rise … Demand for electricity is growing, not only in PJM, but across the United States, driven by data centers that power the digital economy and the development of artificial intelligence as well as the electrification of vehicles and building heating systems.” Daniel Lockwood for PJM.
And data center expansion depends on power generation expansion as well. So, when generation stalls it can also challenge the race to site, build and start these hyperscale data centers. The most recent Chesterfield Energy Reliability Center serves as a good example, where, “Dominion [Energy] has said the project is critical to maintaining grid reliability. It would be the first of six gas plants the company has said in its integrated resource plan will be needed to meet rapidly growing demand, largely driven by energy-hungry data centers across the state.” But appeals by environmental and other groups may tie up the project for some “weeks or months” per reports.
Modeling the Collision between AI and LNG: What GPCM Shows
We know that AI is creating new gas-demand clusters faster than infrastructure can adapt. But how do we measure it? Indeed, we ask in our study on Virginia data centers:
“How much energy – and specifically natural gas – will these data centers need? And how will it impact markets around Virginia and the rest of the country?”
And we find that:
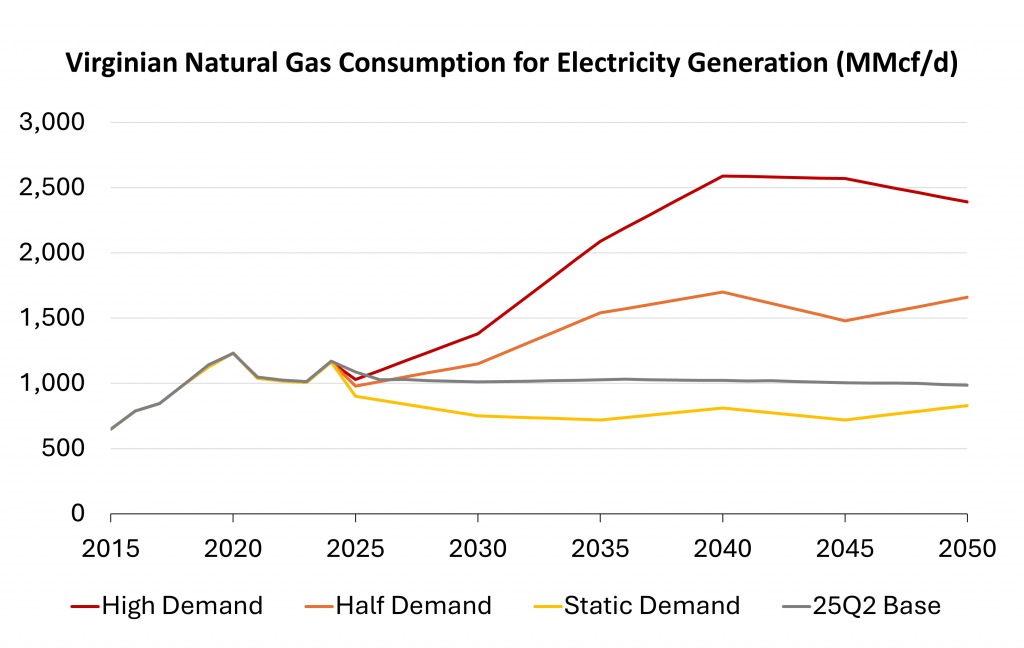
“High Demand Case, we forecast an increase in natural gas consumption from 1.2 Bcf/d in 2024 to 2.4 Bcf/d in 2050, peaking in 2040 at 2.6 Bcf/d. This scenario represented what would happen in an unconstrained demand environment – what electricity generation needs and demand would be if data centers are built in Virginia with no hinderance from transmission development, land use concerns, changes in regulation, etc.”
Figure 3 below shows the high case at 1.6 Bcf/d over RBAC’s base case, the baseline of a more realistic assumed growth by 2040. Nevertheless, growth is likely to continue.
Regional Stress & Risks
While U.S. supply remains abundant, the stress manifests regionally. Rapid data center expansion drives concentrated power load growth, increasing gas burn for generation in clusters like Northern Virginia. When pipeline takeaway and firm transport capacity lag, basis spreads widen, flow patterns shift, and seasonal constraints emerge. Volatility spikes under these conditions, even without a national supply squeeze. In short, infrastructure bottlenecks, not resource scarcity, are the primary risk, and they show up locally first.
Natural Gas Pricing Trends
In June 2008, natural gas prices spiked at Henry Hub to $12.69 per mmbtu. Right around this time, fracking and horizontal drilling came into their own and brought about the “Shale Revolution. Prices dropped for more than 10 years and have been downtrending to the present (Figure 4 below, Trend1). In 2016 the US government approved the export of US LNG and supply ramped up along with demand, keeping prices low to the advantage of exporters (Trend2). Up to and including extreme weather of Winter Storm Uri in Feb 2021 LNG exports had not changed the trend—supply was keeping up with demand.
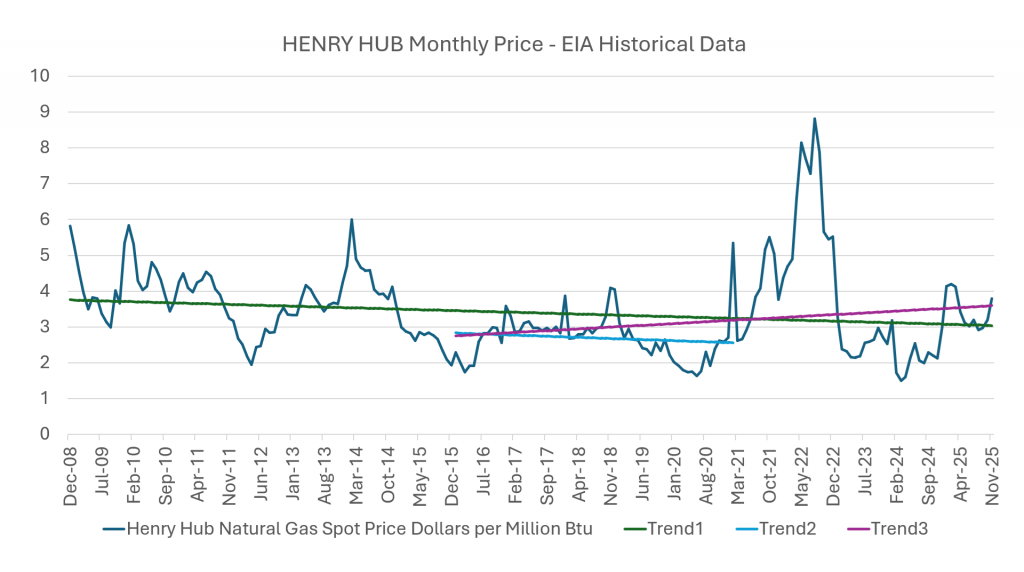
What changed? The Russian supply crunch of late 2021 and invasion of Ukraine early 2022 not only spiked prices, but changed the global LNG market and shifted the price trends upwards. Add to that data centers and AI, famously starting with ChatGPT in November 2022 with 1M users in 5 days, but 100M by March 2023. With newfound power demand, plus a reshuffling of global gas, the trends have changed (Trend3).
Conclusion: Natural Gas as a Strategic Asset
Now, domestically in the US, with LNG exports, AI and data centers (although LNG exports clearly dominate), natural gas markets are being re-defined by competing uses and physical bottlenecks. So, the question may not be, “Is there enough gas?” but rather, “Where will firm capacity exist and who secures it first?”
As increased electrification was on the horizon when the rush to dominate AI changed the energy conversation, another broader question might be, “how will US domestic power generation and LNG exports reshape each other’s margins?”
This is the new 3D chessboard. Understanding how it will play out depending not only on what moves you make, but how the market responds is why modeling tools like GPCM exist and are no longer optional “nice to haves”, but will be essential to prosperity and growth.
GPCM is RBAC’s answer to this dilemma. With it you can simulate alternate futures in the North American gas market to help you design the best gas investment strategy for your own company. See www.rbac.com for more.
RBAC, Inc. has been the leading provider of market fundamental analysis tools used by the energy industry and related government agencies for over two decades. The GPCM® Market Simulator for North American Gas and LNG™ is the most widely used natural gas market modeling system in North America. RBAC’s G2M2® Market Simulator for Global Gas and LNG™ has been instrumental in understanding evolving global gas and LNG dynamics and is vital in fully understanding the interrelationship between the North American and global gas markets.