Global gas and LNG markets are entering a complex phase. Asian demand, led by China’s industrial recovery and India’s expanding gas use in transport, continues to grow steadily, while Europe is balancing modest demand recovery against storage tightness and the legally bound phase-out of Russian LNG and pipeline imports. At the same time, North America is scaling LNG exports at an unprecedented pace, with export volumes projected to rise materially into the mid-2030s. These shifts are not isolated but are interacting across a globally connected system.
The 25Q4 database release of the G2M2® Market Simulator for Global Gas and LNG reflects how these regional dynamics intersect. Near-term European inventory constraints are reinforcing price sensitivity, even as an emerging LNG supply surplus around 2028 begins to reshape the medium-term outlook. Beyond that point, sustained demand growth in Asia and the Middle East is expected to absorb excess supply, setting the stage for a gradual rebalancing. Understanding how these phases unfold requires examining the drivers behind the headline numbers
Recent and Near-Term Market Trends
In 2025, EU countries substantially increased LNG imports in order to support storage injections and, as shown in Figure 1 below, regasification volumes rose by approximately 28.7% compared with volumes in 2024.
However, according to AGSI (Association of Gas Infrastructure) data, EU storage levels reached only about 83% by late October, below the 90% target, and fell further to around 41% by the end of January 2026 amid winter withdrawals. This has tightened the near-term supply balance for the rest of the 2025/26 heating season and could keep the upcoming summer refill period structurally tight, increasing price sensitivity during injections.
As illustrated in figure 3 below, storage performance diverged materially across EU Member States. Several countries met or exceeded the October 2025 storage-fill target, supporting higher projected end of March 2026 inventories and greater flexibility through the fill season, while others entered winter well below target and are expected to begin the 2026 fill season from a materially weaker storage position.
Regional Market Developments
Asia
Asia remains a crucial driver of global natural gas demand, with significant growth observed in key markets such as China and India. China’s economic recovery and expansion in industrial sectors have been particularly influential, and we expect those gains to continue, with overall power, industrial and residential sectors increasing about 10% YoY. Meahwhile India’s initiatives to boost natural gas usage in transportation have also contributed to demand growth, which could reach 19% YoY in major sectors (Figure 4 below). Looking ahead, the region’s demand dynamics are expected to continue evolving, with a growing focus on enhancing infrastructure and securing supply sources, as illustrated by the steady rise in sectoral gas demand through 2030.
In the short term, global natural gas demand has shown significant growth, largely driven by rapid industrial expansion in Asia and the Middle East. The Compound Average Growth Rate (CAGR) in global demand is expected to be around 1.6% between 2025 and 2028. Asia leads this growth with strong industrial activity and an uptick in LNG imports, showing a CAGR in total demand of 5.2% in 2025-2028. The Middle East is the other major driver of global demand, showing a 2.7% CAGR in total demand growth between 2025-2028, primarily driven by growth in ELC, IND and RES sectors. We also are expecting Qatar’s liquefaction capacity to dramatically increase, rising above 200 bcm by 2030.
Europe
2025 saw relatively minimal amounts of demand growth (0.9% increase from 2024). The medium-term outlook towards 2030 shows a stable level of gas consumption, especially in the industrial (IND) and electricity (ELC) sectors. This recovery is driven by Europe’s ongoing transition towards lower-carbon energy sources, which is gradually replacing coal with natural gas in power generation while maintaining a stable level of industrial demand.
Europe’s gas market is moving from the days of crisis response after Ukraine to structural transition post-Russian gas, with demand stabilizing even as supply continues to evolve, particularly in regards LNG.
The majority of LNG enters through Northwest Europe (Figure 6), where regasification capacity has expanded significantly and LNG receipts are projected to exceed 100 BCM annually by the mid-2030s, while the majority of Europe’s pipeline imports arrive from Norway. Remaining pipeline imports arrive through southern and eastern gateways making their way through Eastern and Central European corridors, and particularly to gas-starved Central Europe.
Improvements in European gas infrastructure, including expanding regasification capacities and pipeline interconnections, have bolstered the region’s ability to manage supply disruptions and ensure energy security.
The region continues to focus on reducing its dependency on imported pipeline gas and navigating the complexities of geopolitical influences on supply.
The 25Q4 release continues to reflect key European gas market dynamics, including the ongoing phase-out of Russian gas imports and persistent storage challenges. In January 2026, the European Union finalized legislation under the REPowerEU framework to phase out Russian LNG imports by the end of 2026 and Russian pipeline gas by late 2027, making the transition legally binding while retaining limited emergency derogations (temporary exceptions) when under tight market conditions.
North America
North America continues to strengthen its role as the primary source of global LNG supply in the 25Q4 Base Case, supported by robust upstream production and expanding liquefaction capacity. Continued production growth supports higher domestic gas demand, with the power sector leading incremental consumption.
North American LNG export volumes are projected to expand from approximately 224 BCM in 2026 to ~404 BCM by the mid-2030s, with more modest growth thereafter (Figure 7). Near-term export volumes are slightly higher, relative to our prior release, reflecting stronger realized utilization at key U.S. Gulf Coast facilities—in part due to delays in the Power of Siberia 2 pipeline—as well as incremental capacity additions at Plaquemines LNG. U.S. LNG exports account for the majority of this growth, rising from roughly 200 BCM in 2026 to ~350 BCM by 2035.
Canadian LNG exports are expected to scale materially during the 2030s, reaching approximately 42 BCM by the mid-2030s, while Mexican LNG exports peak around 2030 and stabilize near 9 BCM thereafter, remaining a relatively small contributor to overall North American LNG exports (Figure 8).
In Summary
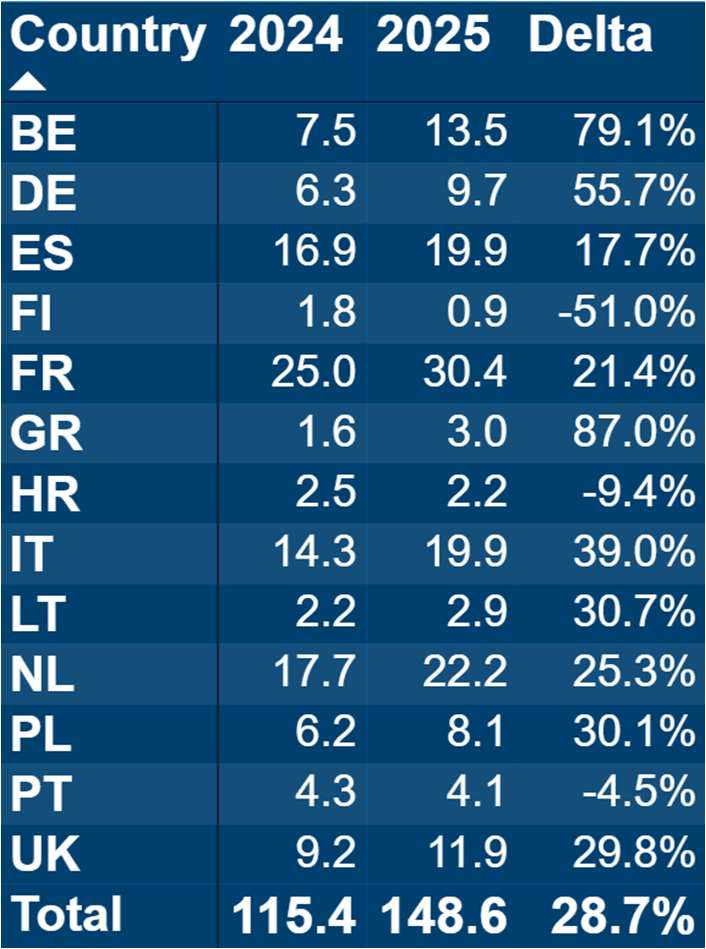
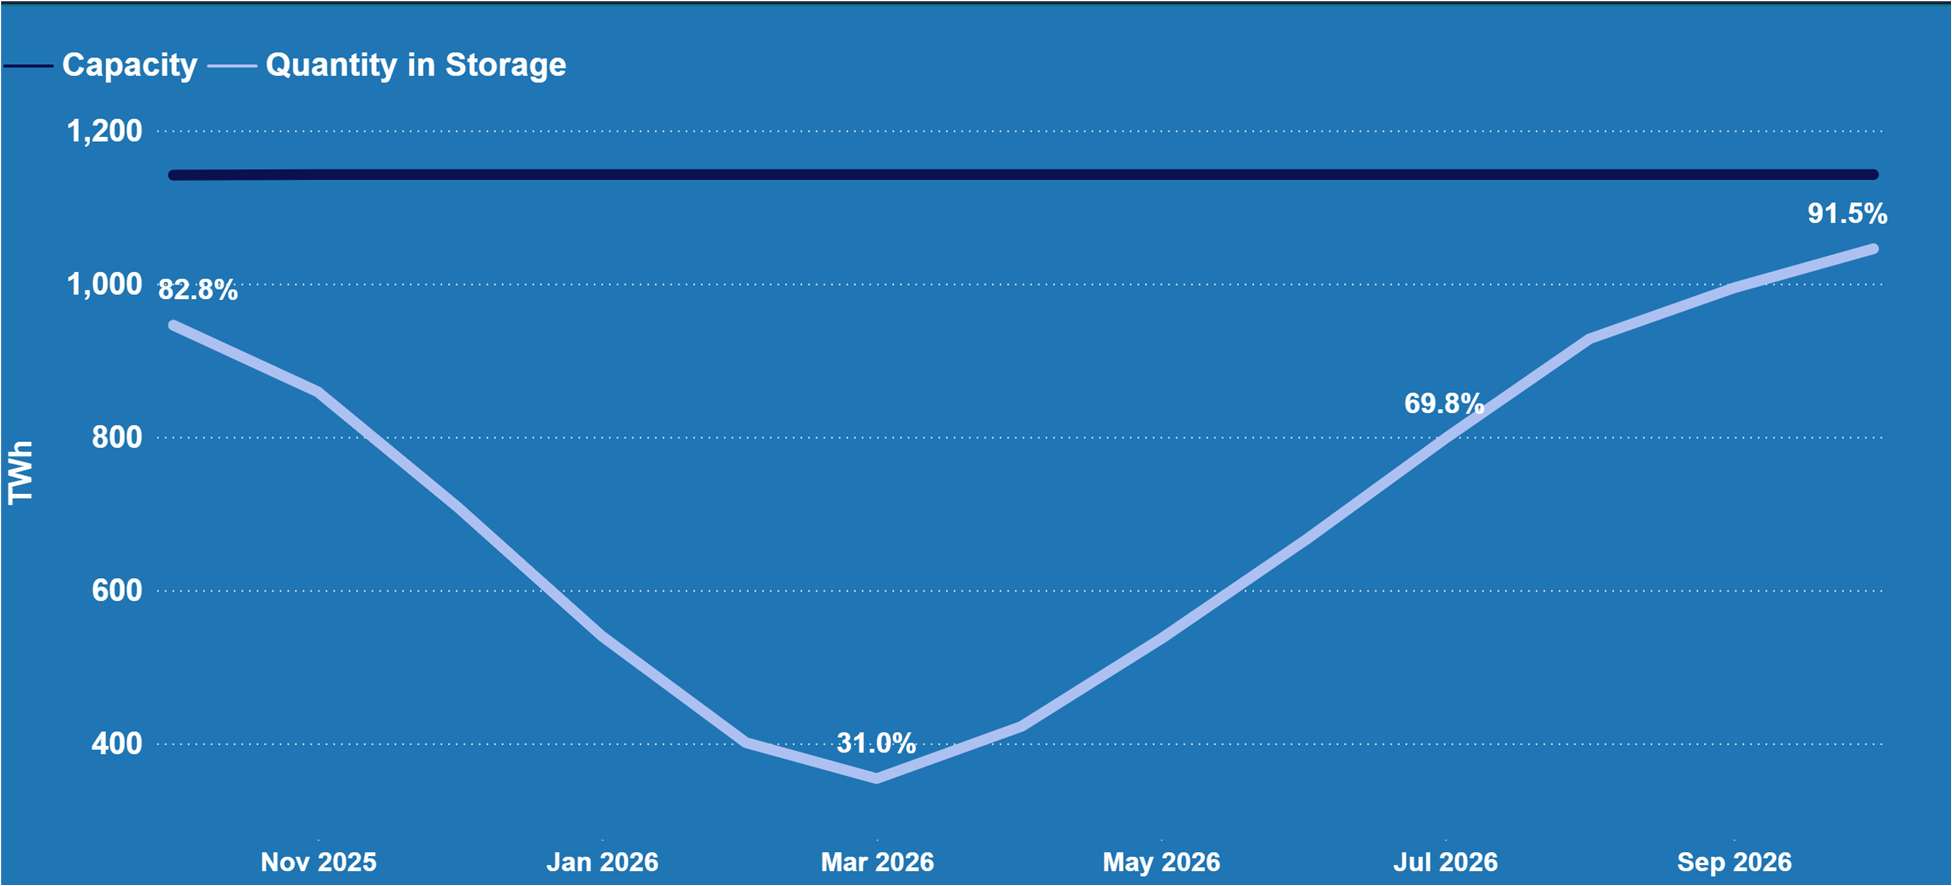
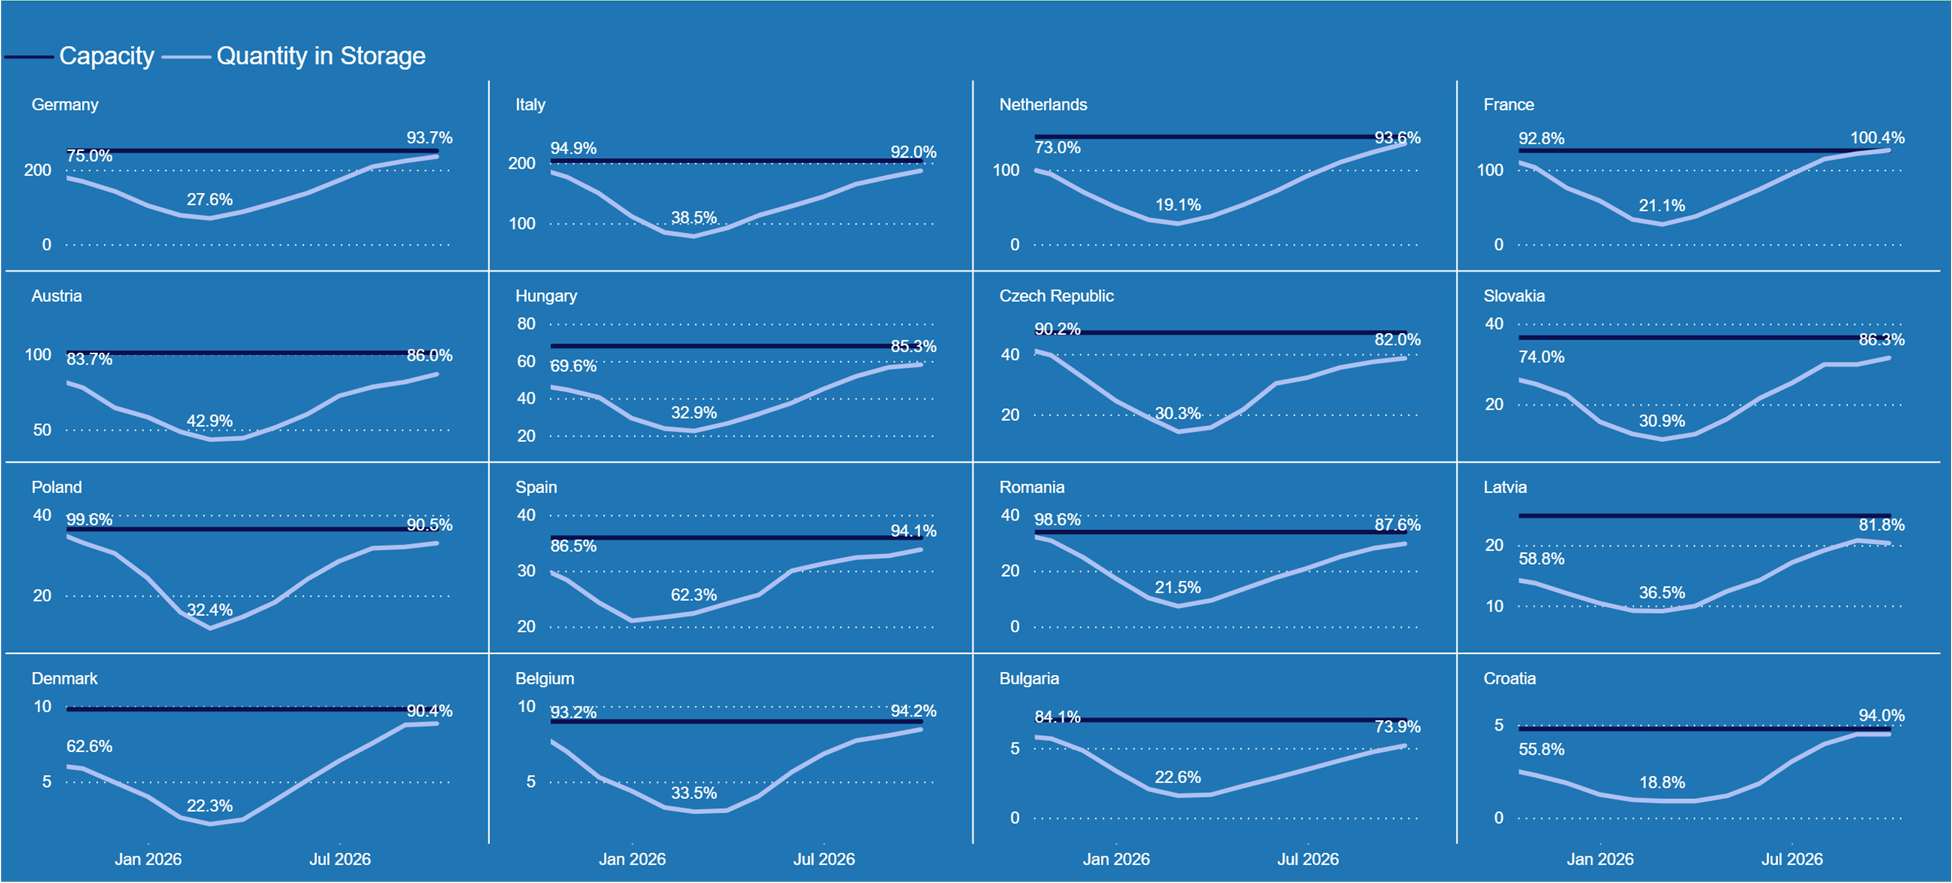
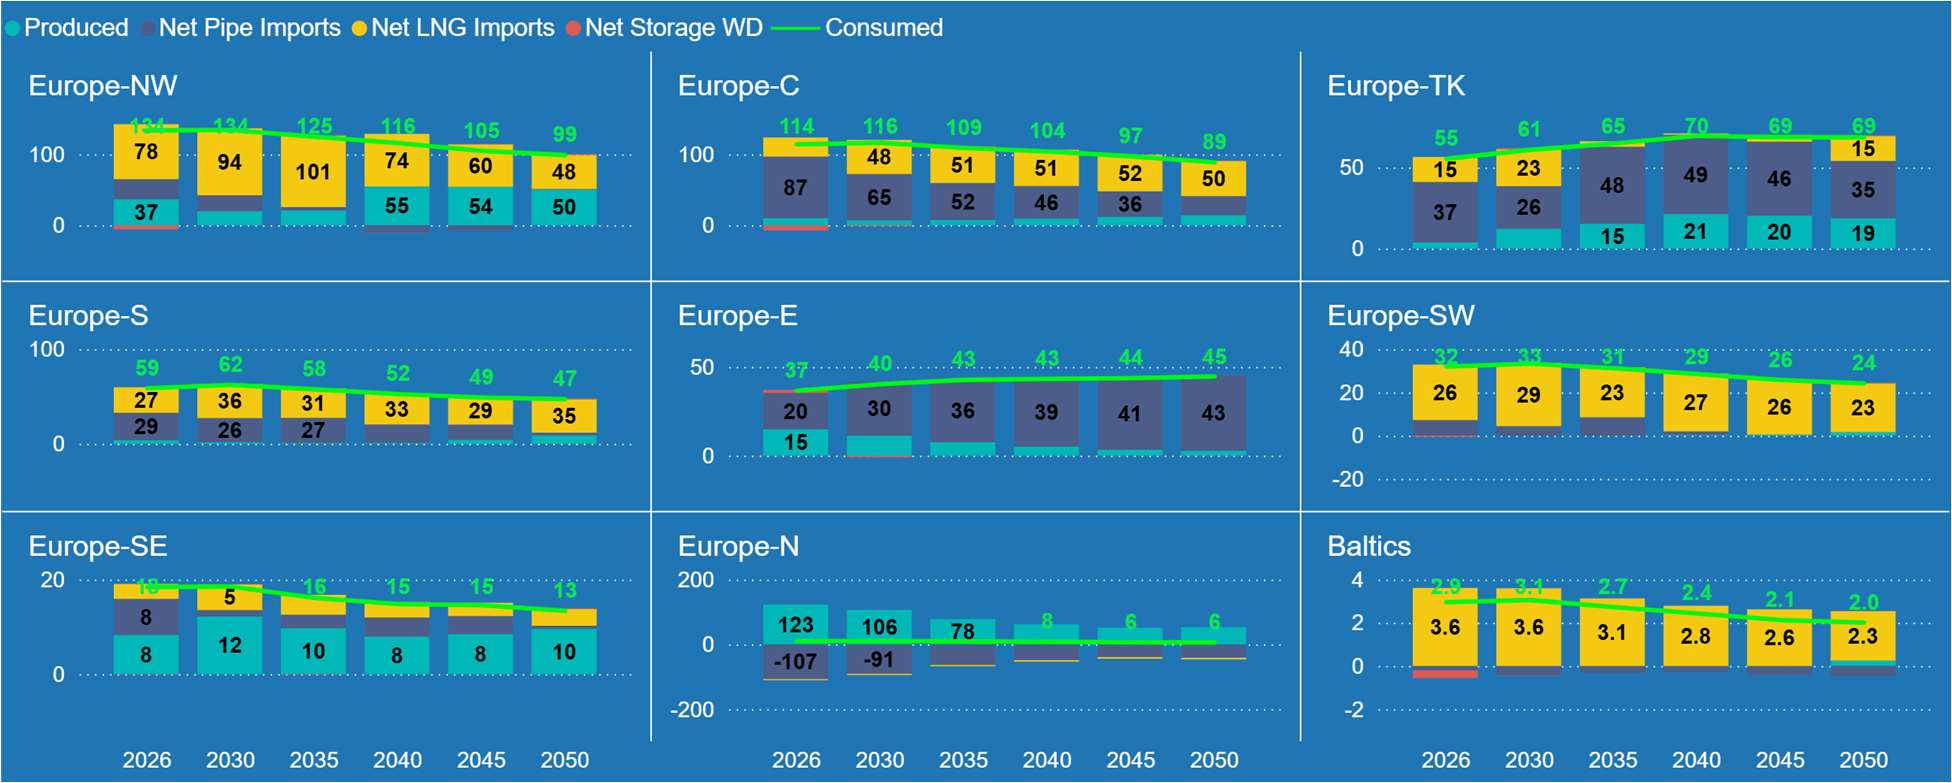
The 25Q4 release reflects key global trends and shifting market dynamics, such as in Europe, where we see lower-than-expected storage levels, tighter near-term supply balances following winter withdrawals, and the legally bound phase-out of Russian LNG by the end of 2026 and Russian pipeline gas by late 2027 under the REPowerEU framework.
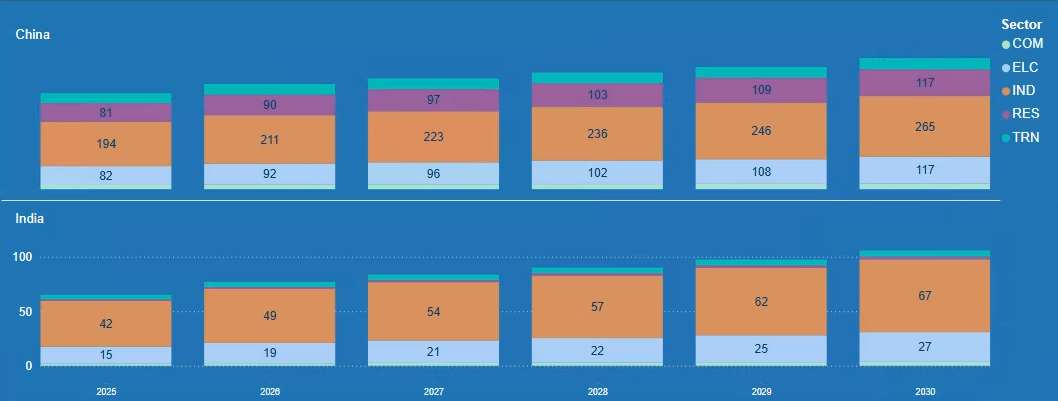
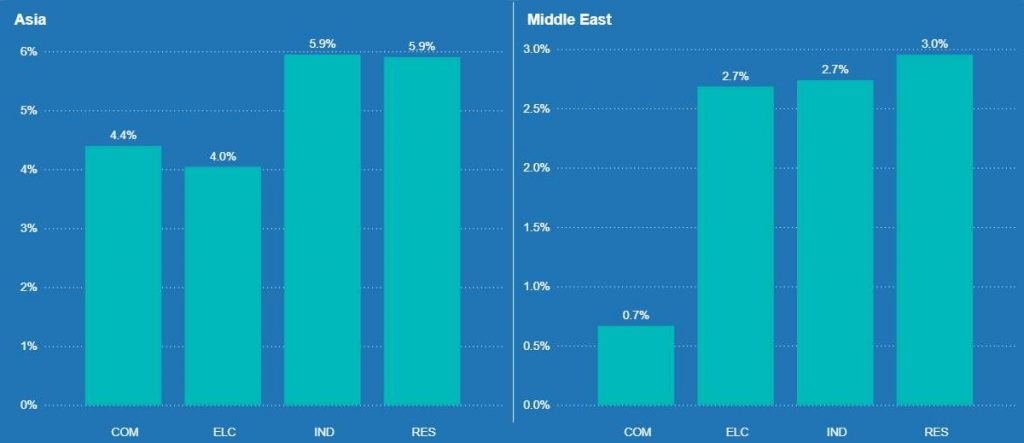
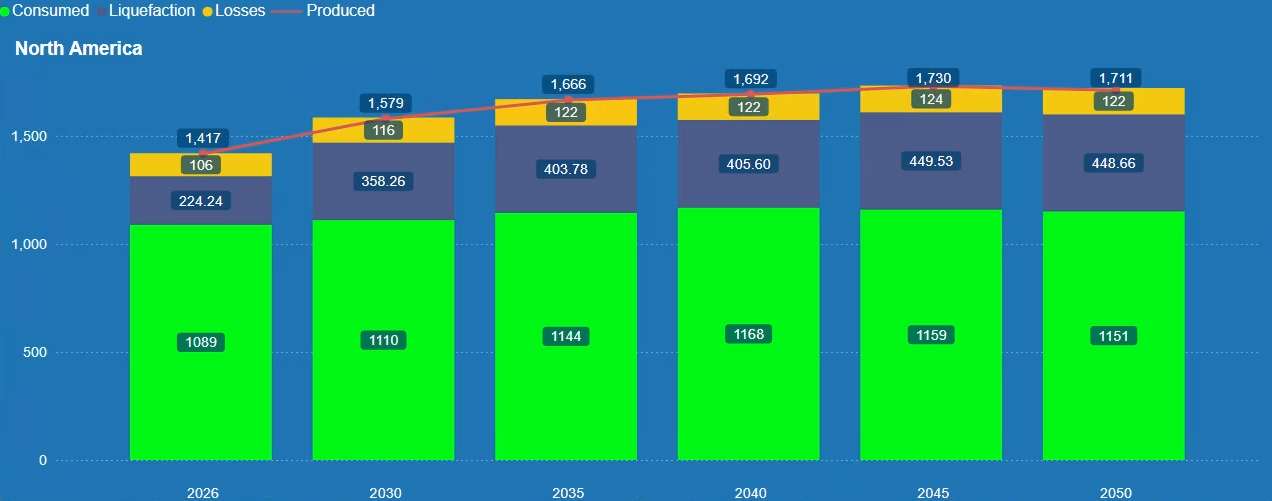
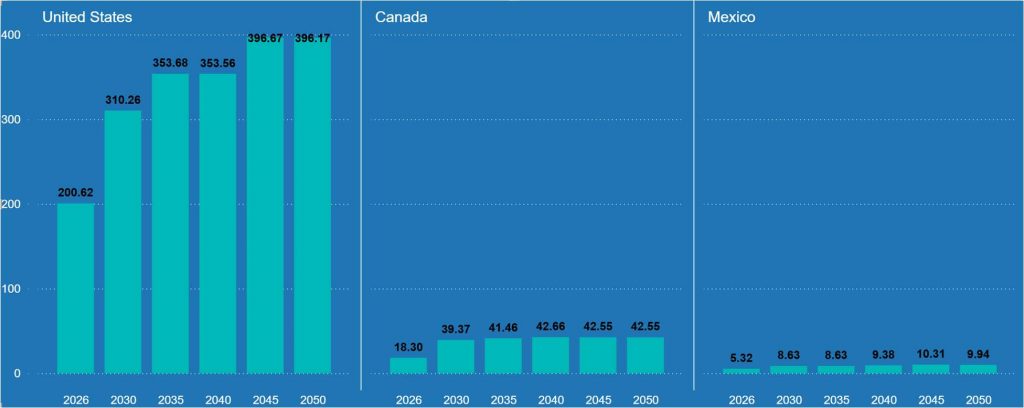
Asia remains a crucial driver of global natural gas demand, particularly with China, but India is also notable. While in North America, rising production is driven by LNG export growth, but also supports higher domestic gas demand, with the power sector leading incremental consumption.
In the medium term, while global liquefaction capacity continues to rise (in the U.S. and Qatar in particular), the outlook continues to point to a potential LNG supply surplus beginning around 2028, which is expected to place downward pressure on global gas prices. Beyond this period, sustained demand growth in Asia and the Middle East is expected to absorb excess supply, supporting a gradual price recovery into the mid-2030s.
It is with tools such as the G2M2® Market Simulator for Global Gas and LNG™ that natural gas and LNG analysts can see how changes in the market affect supply, demand, flows, and prices. For example, one can see how the implementation of the REPowerEU plan will result in new gas supply coming into Europe with Russian gas being fully phased out.
Would you like a demonstration of RBAC’s market simulation tools? Click here for a demo or to contact us for more information. Additionally, join our mailing list to receive articles and other communications from RBAC directly to your inbox.
RBAC, Inc. has been the leading provider of market fundamental analysis tools used by the energy industry and related government agencies for over two decades. The GPCM® Market Simulator for North American Gas and LNG™ is the most widely used natural gas market modeling system in North America. RBAC’s G2M2® Market Simulator for Global Gas and LNG™ has been instrumental in understanding evolving global gas and LNG dynamics and is vital in fully understanding the interrelationship between the North American and global gas markets.