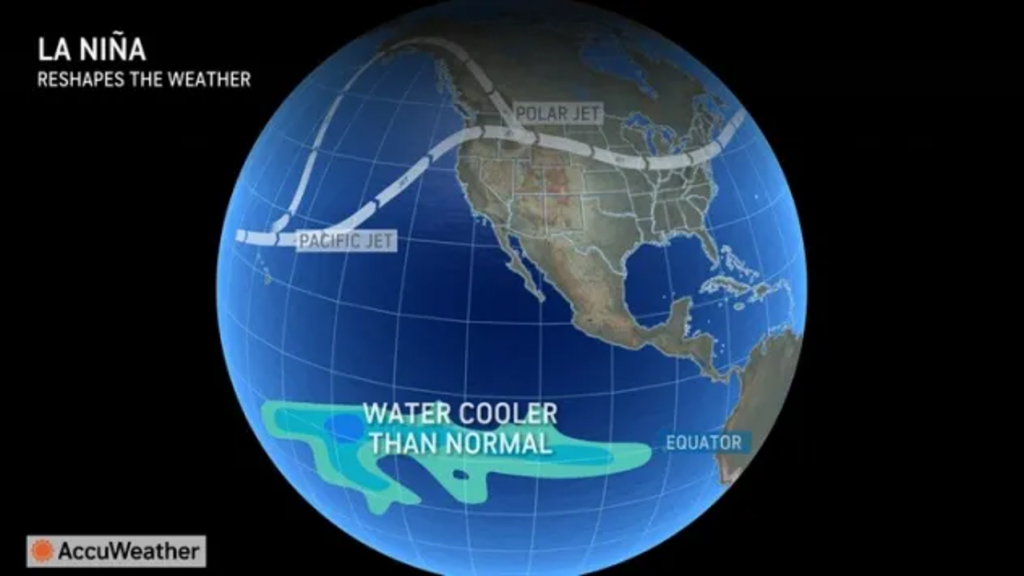
Leading into Winter 2025-26 much of the talk was about the possibility of a La Nina Winter. A La Nina pattern emerges when the surface temperatures of the Pacific Ocean fall below average. While the shift in ocean temperatures may seem insignificant, it can shift the “Jet Stream”, the fast-moving current of air that circles Earth, and impact snow, rain and temperature trends across North America.
Figure 1. La Niña pattern showing cooler-than-normal Pacific Ocean surface temperatures and jet stream shift. Source: AccuWeather.
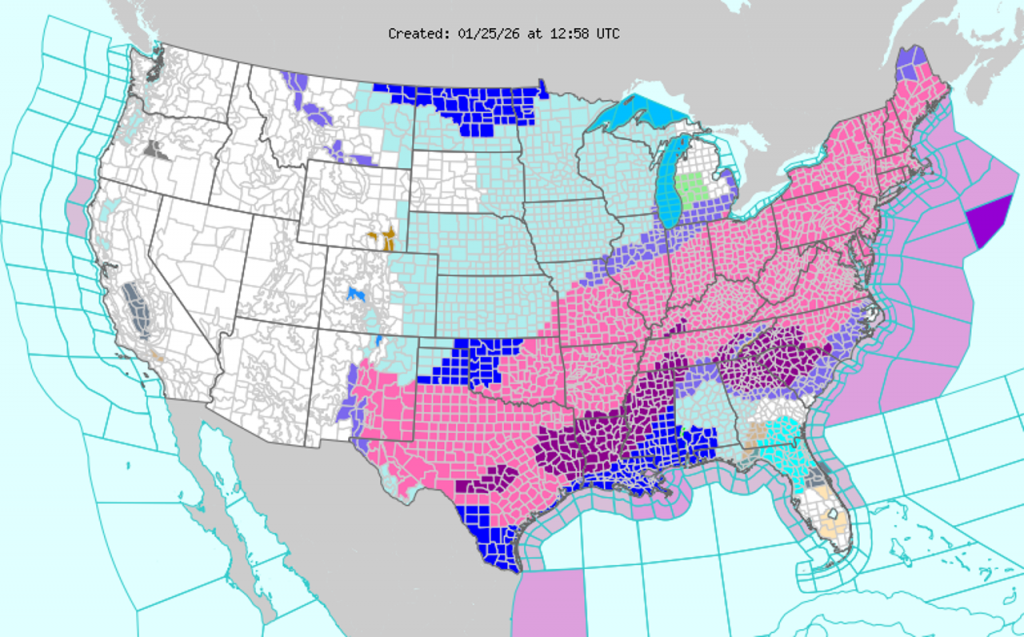
And boy did it. Two thirds of the country was ravaged (see Figure 2 below) by a major winter storm, nicknamed “Fern,” at the end of January 2026, dropping snow and leaving prolonged cold in its wake. Pittsburgh, PA experienced 18 straight days where the high temperature did not exceed freezing. What does this mean for natural gas markets? A lot.
Figure 2. U.S. watches and warnings during Winter Storm Fern (Jan. 25, 2026), “Shades of blue represent cold and extreme cold warnings, magenta indicates ice warnings, and pink and purple show winter storm warnings and advisories.”
Demand Surges, Prices Respond
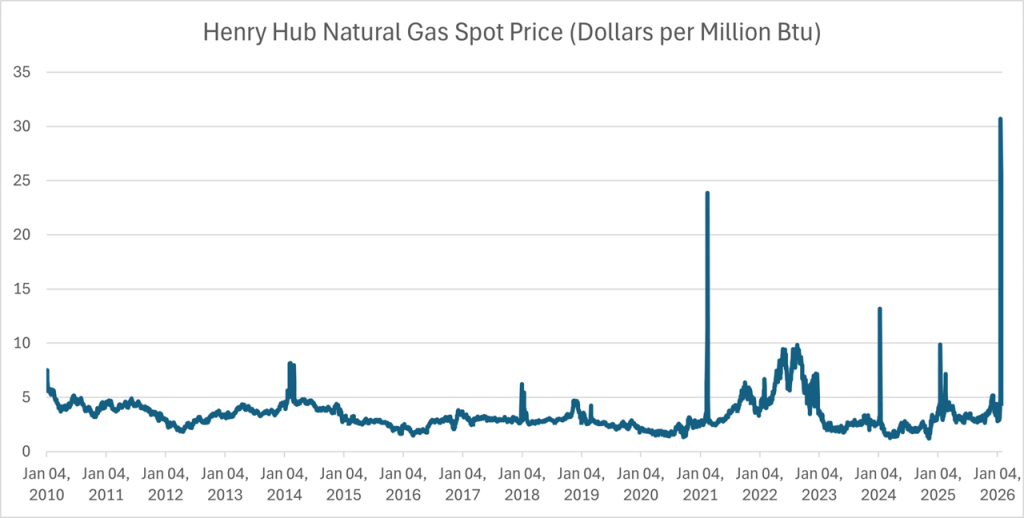
This prolonged cold drove space heating demand to record highs, causing significant short-term pressure on the natural gas markets. This pressure caused meteoric increases in January’s gas prices, even exceeding prices during winter storm Uri. At Henry Hub in Erath, Louisiana, the primary pricing point for natural gas futures contracts, spot prices reached historic levels as shown in Figure 3, touching $30/MMBtu over a long trading weekend. The pricing impact was more profound in the Northeast, where prices at Iroquois Zone 2, representing New York and Connecticut was over $150/MMBtu. Even in the heart of the prolific Marcellus Shale prices hit double digits.
Figure 3. Henry Hub natural gas spot price (2010–2026), highlighting the January 2026 price spike. Data Source: U.S. Energy Information Administration (EIA).
While demand is an important factor in understanding how and why prices move, it is not the only factor. The snow and prolonged cold also affected production. When temperatures drop below freezing it is possible for natural gas wells to freeze shut. This is further exacerbated when there is snow on the ground, lowering the ambient temperature of pipes. By reducing the amount of production available to consumers during periods of high demand, the markets rely on natural gas storage to fill the gap.
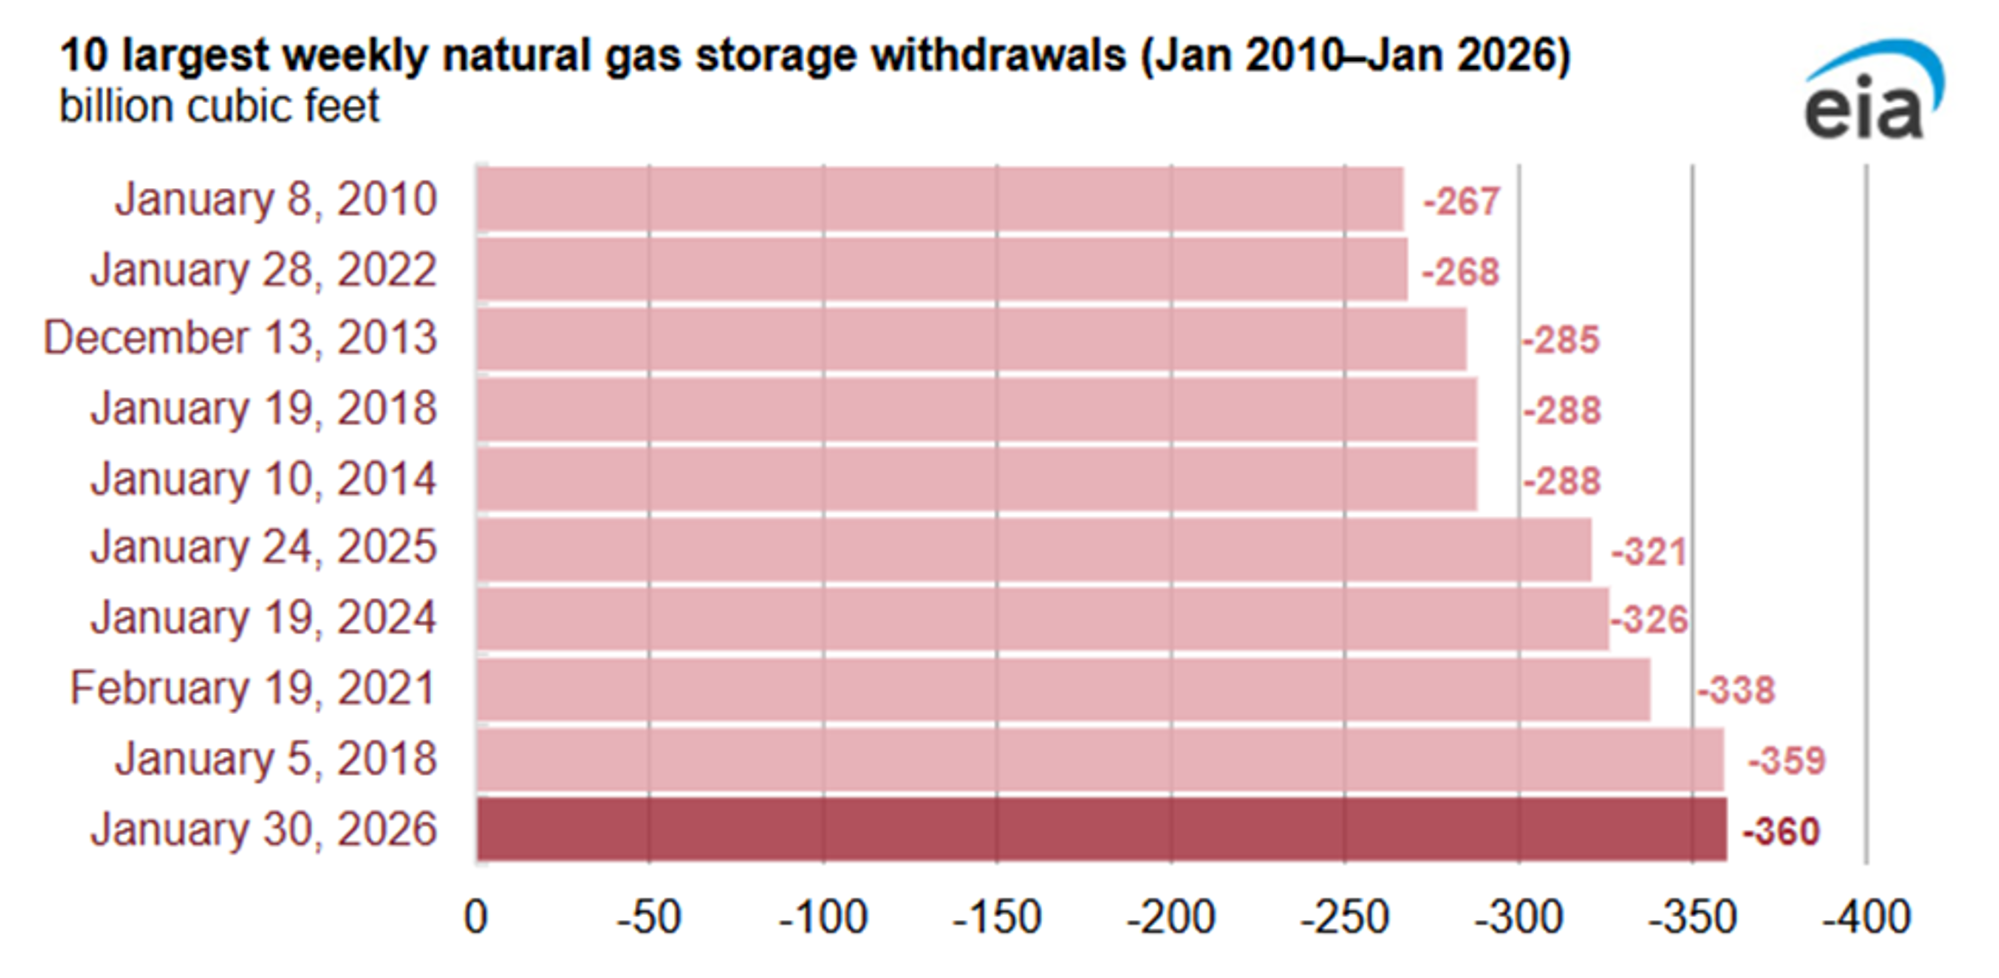
Figure 4. Ten largest weekly natural gas storage withdrawals (Jan 2010–Jan 2026), with Jan. 30, 2026 setting a new record. EIA Source: U.S. Energy Information Administration (EIA)
Storage as the Market’s Shock Absorber
For the week ending January 30, 2026, we saw an all-time high withdrawal from storage to support the market and ensure reliable service (figure 4). This withdrawal was over 80% above the five-year average for the same week. As a result, this historic withdrawal flipped working gas storage surpluses to a deficit when compared to past history.
Storage surpluses tend to put downward pressure on prices while deficits have the opposite effect, i.e., upward price pressure. Fern and its dramatic pull-on storage have lowered the expected withdrawal End-of-Season storage balances. Consequently, this implies, all else being equal, a tighter supply/demand environment during the Apr – Oct injection season, making it more difficult to achieve historic norms for the injection End-of-Season storage balances…
Modeling the Next Fern
While the ferocity and duration of Winter Storm Fern was unforeseeable, we did know ahead of time that it would likely be colder and snowier as a result of the La Nina pattern. It stands to reason this could happen again, and by using GPCM® Market Simulator for Gas & LNG we can create various scenario analyses to mimic this weather occurrence in the future. Our software allows you to answer questions like “Would the Constitution Pipeline have made a difference in reducing the price of natural gas in New England?” or “What impact would a possible capacity outage have on basis?”.
RBAC’s software can be utilized to study disruptions, such as Winter Storm Uri and other severe weather events. So, keep a look out for our future deeper dive into Winter Storm Fern.
For nearly 30 years, RBAC has helped clients use GPCM® Market Simulator for Gas & LNG to create custom scenarios, analyze the results, determine risk and opportunities and position themselves for whatever the market or mother nature may have in store. So, when opportunity knocks, you can answer.
Would you like a demonstration of RBAC’s market simulation tools? Click here for a demo or to contact us for more information.
RBAC, Inc. has been the leading provider of market fundamental analysis tools used by the energy industry and related government agencies for over two decades. The GPCM® Market Simulator for North American Gas and LNG™ is the most widely used natural gas market modeling system in North America. RBAC’s G2M2® Market Simulator for Global Gas and LNG™ has been instrumental in understanding evolving global gas and LNG dynamics and is vital in fully understanding the interrelationship between the North American and global gas markets.