Boy bands may be making a comeback, even if it is only for laundry detergent commercials. But in the natural gas trading world, producers’ actions, or reactions, seem to be occurring more rapidly than previously thought. The implications on supply response to price, “elasticity” in the econ world, can certainly change the shape of short run supply curves. If producers are acting more like traders these days, and short-term supply elasticity becomes more responsive, what are the market implications and how profound might this be?
Since the beginning of 2024, we’ve heard a harmony of producers belt out at least a couple of production curtailment verses due to lower natural gas prices. These announcements started even prior to winter’s coda, with EQT, Antero, Comstock, Chesapeake, and other producers responding quickly to NYMEX prices heading toward the $1.50/MMBtu level. Gas producers started throttling back supply to help tighten supply/demand balances which became exceedingly loose due to record high production and a very warm 2023 – 24 winter season.
Like OPEC+ cuts, US gas producers are not intending to throttle back productive capacity. They see the light at the end of the tunnel, and it’s not the front of an oncoming train. It’s LNG exports ramping significantly starting in late 2024 and continuing for the next 2 – 5 years. In fact, this light would be an oncoming train, and still may be, if productive capacity is not maintained or if there are issues restarting Drilling & Completion (D&C) activities in time to match the increased LNG exports.
LNG export infrastructure requires what is effectively take-or-pay contracts to achieve FID, or actual investment dollars to be built. Consequently, once built, a logical assumption is that these terminals will operate at high utilization rates to service the contracts that convinced investors to finance them in the first place. Thus, there’s a pretty good sense of terminal demand and the necessary additional supply to meet this demand. This is exactly the reason US gas producers are diligently trying to maintain their productive capacity.
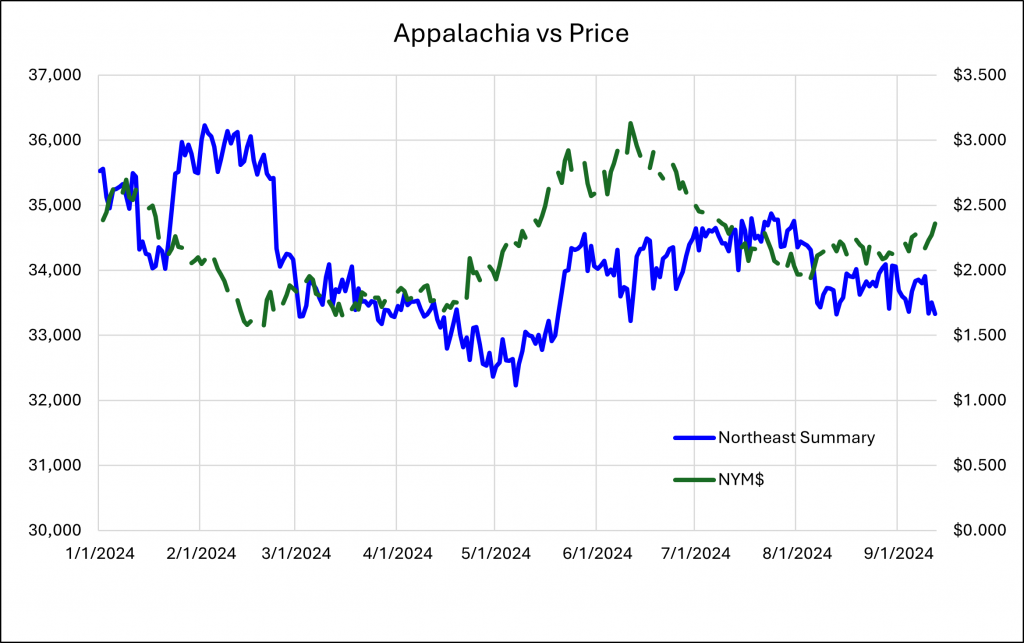
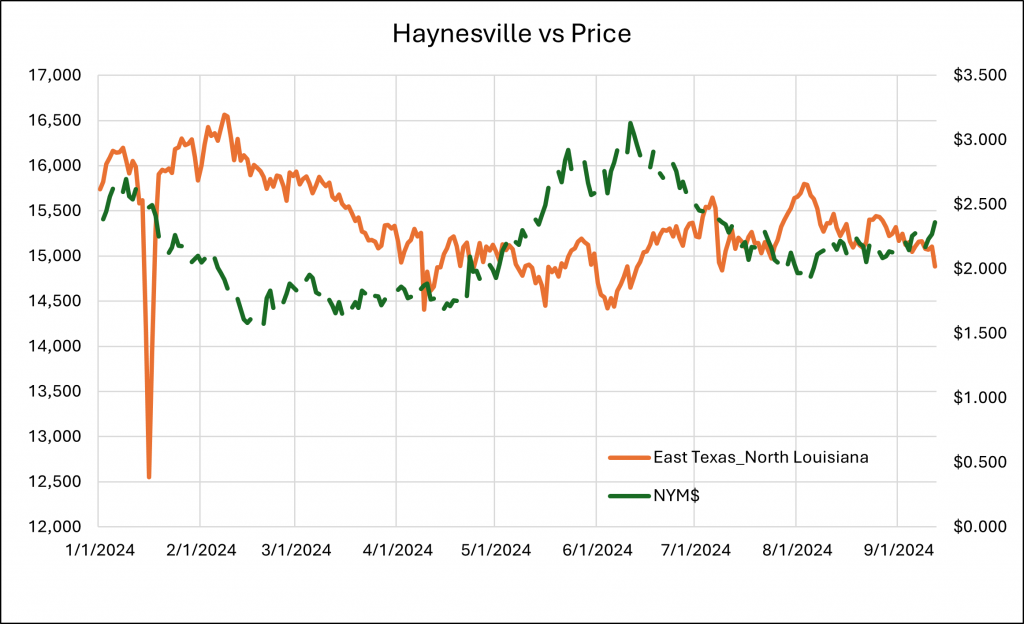
The first set of production curtailment announcements hit the news wires in February 2024. [1] Before winter was over, NYMEX natural gas prices dropped and closed below $1.60/MMBtu. Less than a week later, large producers in both Appalachia and Haynesville announced production cuts. A good portion, if not most, of these plays are more gas-centric and thus more susceptible to gas prices, not crude oil or NGLs prices. The Appalachia response is clearly shown in the graph below.
What’s curious with respect to EQT is their goal to be the lowest cost producer in their selected basins and thus the producer that is most capable of handling low gas prices. Barring any cash flow or debt convenance requirements, if the lowest cost producer finds it prudent to curtail production, it likely makes sense for other producers to do the same. Hedges, which many or most producers have executed, offset lower prices, and surely helped some producers maintain production during this low-price period. One might then wonder how much greater curtailments might have been without any hedges in place.
Antero on the other hand, has significant exposure to “rich” gas production, or gas that has large quantities of embedded NGLs. It is important to note here that any NGLs uplift, i.e. revenues generated by sale of these liquids, need to be considered as well, since NGLs can dramatically change marginal cost economics. Something else to keep in mind is that NGLs prices (specifically the propane and heavier components, i.e., C3+ stream) are much more correlated to crude oil prices, NOT natural gas prices. However, even companies with significant NGLs exposure were throttling back D&C and gas production.
But the “song remains the same”—the cure for low gas prices is low gas prices. If prices drop to levels where it’s more economic to leave gas in the ground than to produce it, then it stays in the ground. So, what makes now different from history? For one thing, producers appear to be quicker to respond to “somewhat” higher prices.
Natural gas prices remained range bound from mid-February to end-April, bouncing between $1.50 – $2.00/MMBtu. This is typically a trader’s nightmare—a low-price and low-volatility market environment. It often feels one can’t get short price nor volatility fast enough or in enough size to do well, and by the time you get there, the market turns and wipes out any profit quickly.
From a producer’s perspective, so long as cashflows are sufficient to cover operating costs and dividends for the next few-to-several quarters, this price and volatility environment is sustainable. Especially if the forward curve or supply/demand balances are likely to tighten, producers are likely to be less impacted by quarterly returns than traders.
But then May hit (Jun24 prompt NYMEX contract). Prices rallied from around $1.50/MMBtu to a peak over $3.00/MMBtu by mid-June. Strong ELC demand, expectations of year-on-year (YoY) LNG export gains, production curtailments and quite likely some shorts getting stopped out, helped push gas prices higher.
But a “new trader on the block” was there to start flowing gas that was previously curtailed, at least to some extent. News hit the wire in mid-June that EQT was bringing back about 1 Bcf/d of production, even before any new LNG export capacity was coming online. Recall that light at the end of the tunnel? [2] This demonstrated a much more elastic supply than previously seen. It is worth noting that the Mountain Valley Pipeline (MVP) was getting ready to commence operations in June so that may have also influenced producer decisions.
Also curiously, right as prices started to move higher, Chesapeake decided to further curtail production after lower 24Q1 profit realizations. [3] Chesapeake has production in both the Haynesville and Marcellus, so how much curtailment can be attributed to each play is uncertain. However, with premium markets these days typically centered around the Southeast and LNG terminals along the Gulf, gas flows from both plays tend to head toward these premium markets.
Haynesville is a deeper play with higher drilling and completion costs but one which benefits from strong initial production rates. Nonetheless, Haynesville largely stayed range-bound during May and June roughly between 14.5 – 15.0 Bcf/d before moving slightly higher to between 15.0 – 15.5 Bcf/d starting around July. With decent infrastructure build-out happening and its proximity to LNG export terminals, it may pay for Haynesville players to hold off significant production ramps until LNG exports increase and prices attain consistently higher levels.
It also is the case that many “smaller” non-multinationals have added or beefed-up trading teams to their headcount. This increased sophistication not only helps with timing and execution of hedges, but also asset optimization, risk management and overall decision making. This importantly includes deciding when production curtailments or resumption make most sense.
One more note on hedging. Producers tend to use a variety of financial hedging structures, some as simple as selling swaps or futures. Others are a bit more complex, employing 3-way option structures which can include selling a call option in combination with buying put spreads. (Let’s reserve the intricate details of such structures for another time.) Regardless, it appears that usage of these hedging structures is declining. There are numerous reasons why this may be the case but suffice it to say, lower hedge percentages make both the likelihood and magnitude of production curtailments greater.
The sample size to test this “new trader on the block” hypothesis is small so it’s important not to draw too many conclusions or to bet heavily that producers are going to be more trader-like going forward. But it is something to consider and work into one’s analytics by testing alternative scenarios related to supply elasticity, especially on a regional basis. The implications of such operational shifts can have significant impacts on both Henry Hub (i.e., NYMEX) and basis prices.
RBAC’s simulation systems, such as the GPCM Market Simulator for North American Gas and LNG, are designed to evaluate these exact scenarios. Users can easily and quickly modify supply, demand, or infrastructure assumptions—including curve shape, i.e., elasticity—at a very granular level. Running and evaluating alternative scenarios effectively provides a distribution of potential outcomes allowing traders, asset managers and other industry participants to better manage their portfolios and risk.
RBAC is here to assist, step-by-step, so feel free to contact us for more information.


