
President Trump just canceled the “LNG pause”. It may make moot the recent DOE report done as part of President Biden’s “Pause” last year but most certainly makes moot former Secretary of Energy Granholm’s letter accompanying this report with a new Secretary soon to be appointed in Chris Wright, CEO of Liberty Energy.
But the question still remains, how will President Trump’s DOE do things differently? And what did the DOE report say anyway? Was there anything at all to it, really?
Well, the DOE report did highlight several key points about the U.S. natural gas market and using GPCM and G2M2, the industry-leading software for natural gas market modeling of North America and the Globe, here are some thoughts to add to DOE’s report which is summarized in bullet points below, with our notes in italics:
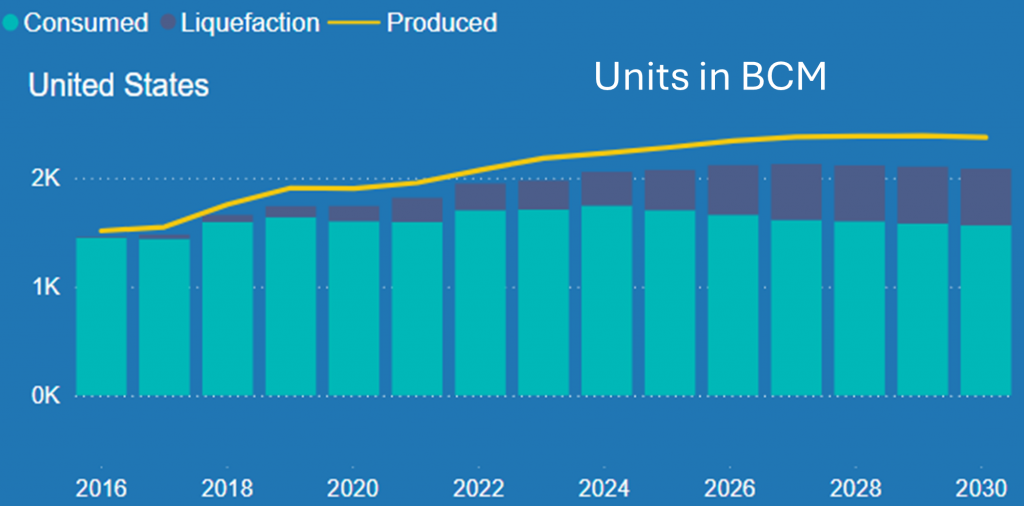
1. Sufficient Supply: The U.S. can meet both global and domestic demand for LNG, ensuring a stable supply across all scenarios.
In the latest Base Case release from RBAC, we see the United States with production room to spare in both domestic and global needs on exports. Could developing economies capitalize on this?
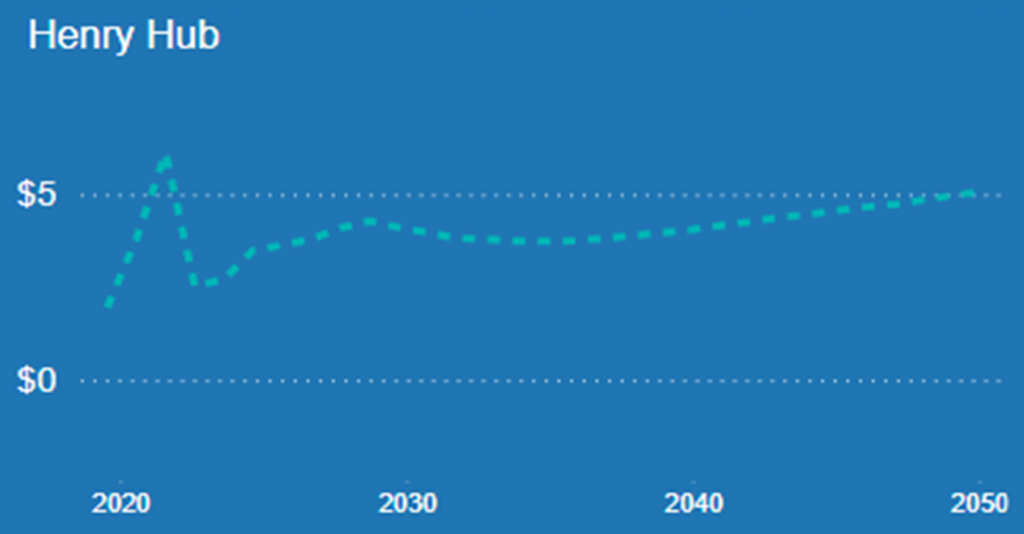
2. Henry Hub Price Increase: Export levels based on global demand projections lead to a 31% increase in Henry Hub prices by 2050, from $3.53/MMBtu to $4.62/MMBtu.
These numbers are not unreasonable, but the question is more what you take from them.
3. Price Volatility and Exports: The report indicates uncertainty in price volatility due to the U.S.’s unique role as a major producer, consumer, and exporter.
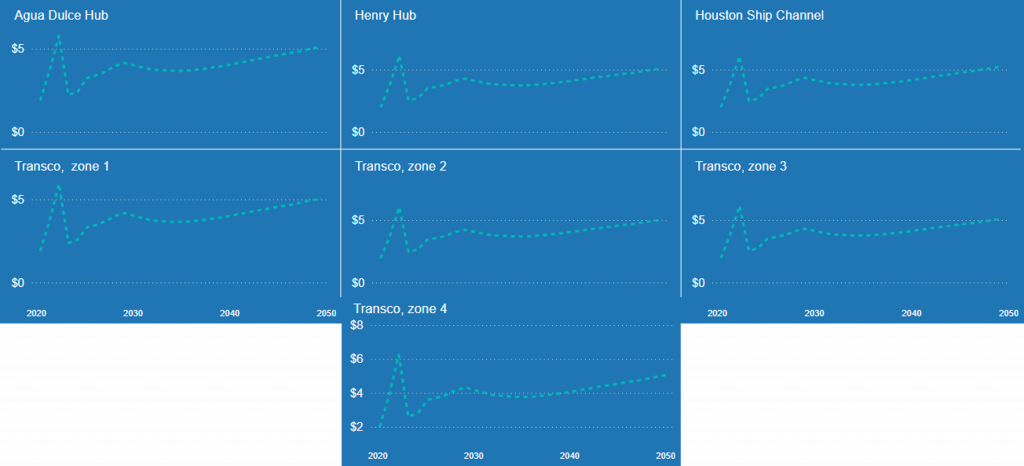
4. Regional Price Impacts: Increased LNG exports affect domestic prices differently by region, with the Gulf Coast and Southwest experiencing the greatest impacts.
Again, we do see various impacts on different price points throughout the U.S., but LNG exports will be only one factor. One can model less or NO LNG exports and see how things will change through time seeing various factors and how sensitive price is to single ones.
5. Residential Price Increase: Higher LNG export levels in 2050 are linked to a 4% increase in residential natural gas prices.
6. Energy Expenditure Impacts: Increased natural gas prices lead to higher annual energy expenditures for households, up to $122.54 per year.
7. Industrial Output Increase: Higher LNG exports boost gross industrial output by up to 1.3% or $203 billion in 2050.
8. Total Energy Costs: The industrial sector’s total energy costs increase by $125 billion from 2020-2050 due to higher natural gas prices.
9. GDP Growth: Increased LNG exports contribute to a 0.2% GDP growth in 2050, equating to $80 billion.
Enhancing Energy Security
The DOE report also underscores the importance of energy security:
10. Global LNG Market: The expanding LNG market and infrastructure highlight the growing demand and shifting demand centers.
11. Export Authorizations: U.S. LNG export authorizations allow flexibility to follow global market demand.
This should now change with new executive orders just signed.
Cost-Competitiveness and Stability: U.S. LNG remains cost-competitive and stable, supported by long-term contracts.
Contract data is included in G2M2 Market Simulator for Global Gas and LNG.
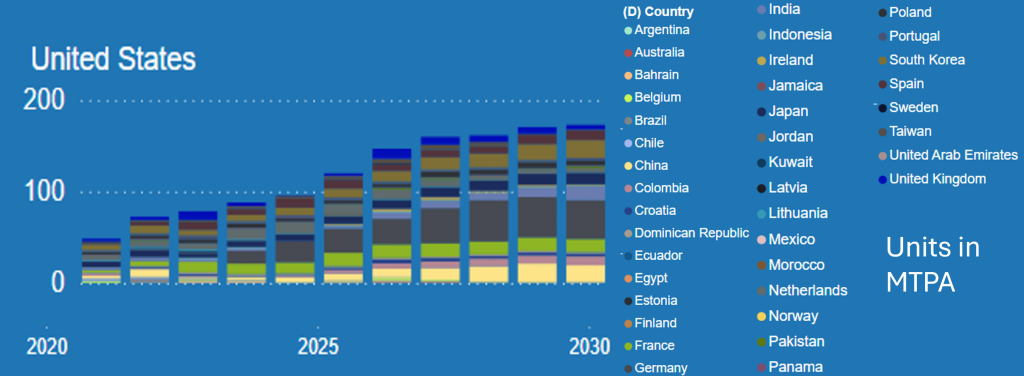
11. Importers: The top importers of U.S. LNG have shifted post-2022, with Europe now accounting for over 63% of imports.

12. Energy Security Strategies: Diverse energy portfolios, including LNG imports, are crucial for maintaining energy security.
13. Future Demand: Uncertainty remains about future demand, with European policies reducing fossil fuel use and increasing demand in Asia, particularly China.

Addressing Greenhouse Gas Emissions
The DOE report also examines the global greenhouse gas (GHG) consequences of U.S. LNG exports:
14. Global GHG Consequences: The impact depends on market effects, such as changes in energy demand and sources used.
15. Increased Availability of U.S. LNG: In the Defined Policies scenario, increased availability of U.S. LNG can influence global energy consumption and GHG emissions.
This is just a broad summary of the key findings in the report.
Today, we behold a very dynamic natural gas market both in North America and globally. In such an energy landscape, robust and reliable natural gas and LNG market forecasts are crucial. The GPCM Market Simulator for North American Gas and LNG and G2M2 Market Simulator for Global Gas and LNG are designed to meet this need, offering unparalleled flexibility and transparency. This powerful tool enables analysts to create custom scenarios, import their own assumptions, and generate reliable forecasts for up to 30 years into the future.
In navigating the complexities of the natural gas market, especially in light of recent findings from the Department of Energy (DOE) report on domestic natural gas supply and economic impacts, the GPCM Market Simulator is an indispensable tool for analysts and decision-makers. Here’s why:
- Custom Scenarios: Create and analyze a wide variety of market scenarios based on your unique assumptions and goals.
- Transparency: The fully transparent database allows you to input proprietary data and assumptions, ensuring confidence in your results.
- Comprehensive Analysis: Simulate historical and future market conditions, including gas production, pipeline and storage capacity utilization, and commodity prices.
- Versatility: Use GPCM for M&A strategy, corporate strategy, energy transition strategy, risk analysis, portfolio optimization, and asset valuation.
Empower your market analysis with the RBAC’s Market Simulators and stay ahead in the ever-evolving natural gas and LNG markets. Contact us today for any questions or to schedule a demo to see how these tools can optimize your market forecasts and strategic decisions.
RBAC, Inc. has been the leading provider of market fundamental analysis tools used by the energy industry and related government agencies for over two decades. The GPCM® Market Simulator for North American Gas and LNG™ is the most widely used natural gas market modeling system in North America. RBAC’s G2M2® Market Simulator for Global Gas and LNG™ has been instrumental in understanding evolving global gas and LNG dynamics and is vital in fully understanding the interrelationship between the North American and global gas markets.

