Everyday market participants, through their collective buying and selling of natural gas futures, help determine the forward curve settlement prices. Each participant has their own opinion of what the “fair market value” of natural gas is or should be. We all know opinions are often biased by our natural position – are we a producer who is naturally long, a consumer who is naturally short or a speculator that for whatever reason believes prices are too low or too high.
The forward curve captures these collective opinions and provides what statisticians like to call the best unbiased estimator, at least in the near-term, where the market is most liquid.
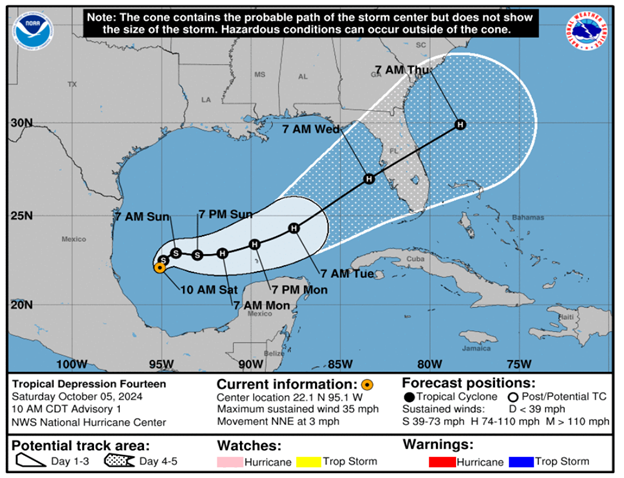
Beyond a few years though, liquidity starts to dry up. The forward curve estimator starts to become more of an approximation versus an actual transactable price for any sizeable volume. Anyone trying to hedge significant volumes or place a sizeable speculative position in this period would be well advised to think of the forward curve like a hurricane landfall forecast several days out – a good sense of where it should land but still very speculative.
So how should analysts and market participants interpret price forecasts that deviate significantly from the forward curve? Are models, analysts, consultants, et al, that provide these deviant forecasts just out of their minds or are they on to something that other people do not see?
As noted, we all typically come to the table with opinions, pre-conceived notions of how the world works, theories that fit our biases, or simply what we believe as the most likely assumptions to occur over the next 1, 2, 5 years or more. Flawed or not, these assumptions directly impact price forecasts. One hopes that in the near term, where there is more clarity, the spread between the forward curve and alternative price forecasts will be narrow. Otherwise, a solid forecast may be mistaken for pyrite and discarded, instead of being recognized as a genuine golden opportunity.
Looking at RBAC’s G2M2 simulation system and focusing on the next 1-year forecast, one can easily see that the CME Forward Curve and G2M2’s forecast are quite similar. In fact, the correlation between these two price curves is quite high at 96%.
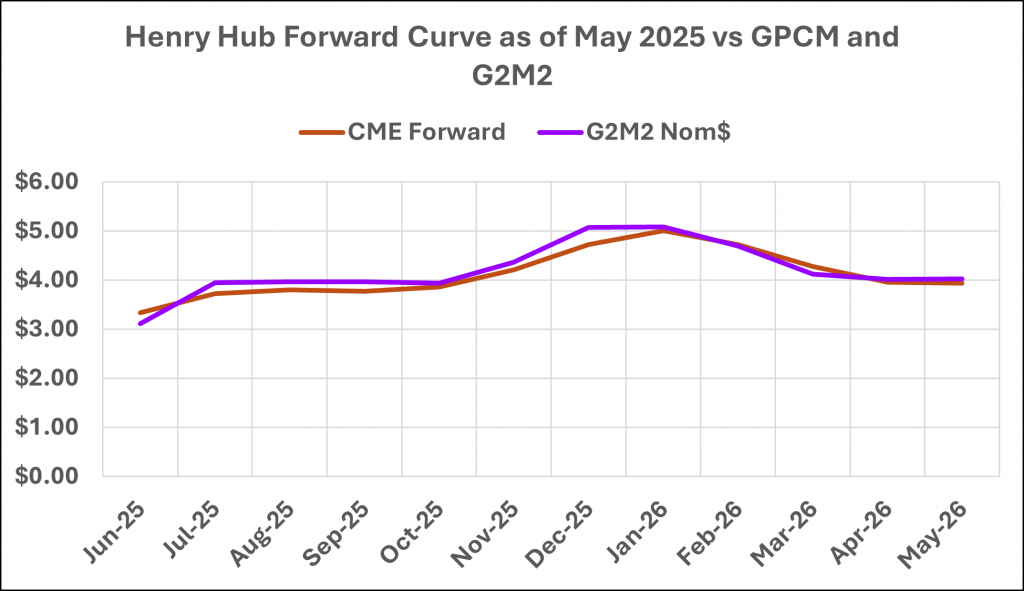
Extending this analysis out to the 2-year time horizon, the correlation between the two price forecasts is still pretty solid at 88%. So, for the next 2 years, G2M2 agrees with the market’s price perception.
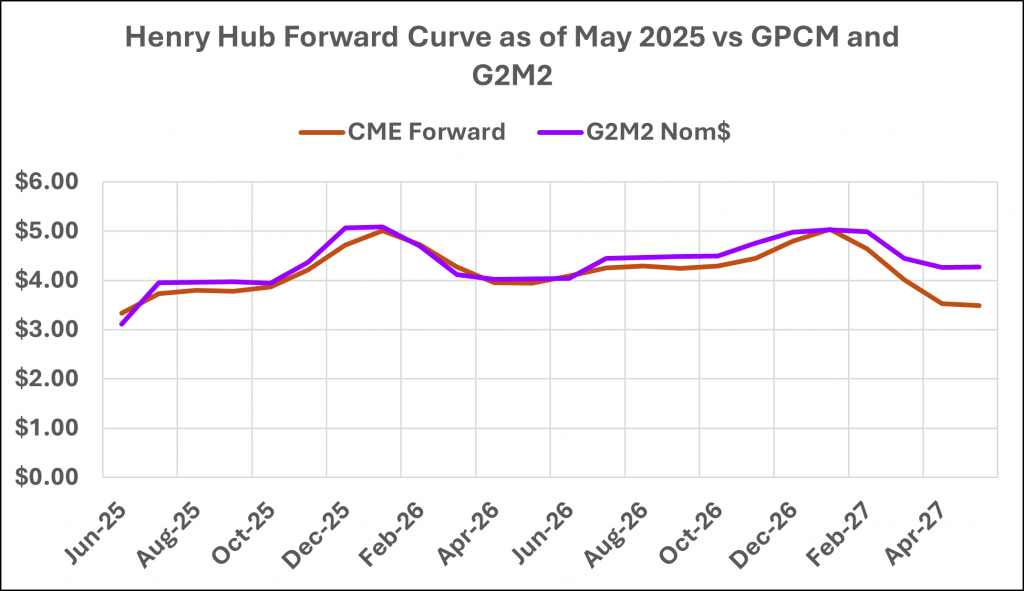
The CME currently provides a natural gas forward curve through 2037, or 12 years out. RBAC’s G2M2 model currently forecasts prices as far as 2050. Unsurprisingly, forecasting confidence is inversely related to time – the further out one forecasts, confidence of forecast accuracy diminishes. Thus, the wider “cones” we see, just as in hurricane landfall forecasts. This is exactly what is observed in the 12-year comparison graph below. The correlation between the CME forward curve and the G2M2 forecast drops to -1%, no correlation whatsoever!
The next logical question would be, what is the main reason for this disparity? What is the market perceiving that the G2M2 forecast is not, or vice versa?
Neither the market nor G2M2 are blind to US LNG export growth, which will continue over the next 5 years. This new capacity is either already FID’d or is reasonably expected to be FID’d soon. So, the expected doubling of US LNG export capacity is known.
Likewise, AI/Data center demand is expected to, at a minimum, keep gas-for-power demand at least flat, rather than declining, for the next several years. Arguably, the market is factoring in a reasonable likelihood that gas-for-power demand will increase over the next several years. Some examples of this include the dramatic pop in NRG’s stock price after its announced acquisition of LS Power’s gas generation portfolio and numerous articles that discuss analysts raising gas-for-power demand forecasts. The question seems to be, how much more gas demand will occur, not “if” it will occur.
RBAC is currently assuming gas-for-power demand to remain flat throughout its forecast, i.e., through 2050. Anecdotally, values as high as 10 – 15 Bcf/d of additional gas-for-power demand have been discussed, information most likely included in the forwards. Consequently, it does not appear that the demand side of the equation is driving the price gap between G2M2 and the CME forward curve.
If supply is the culprit, i.e. the principal cause, then the shape of the forward curve suggests that supply is available but is merely waiting for demand to arrive. Consider this, June 2025 is trading around $3.35/MMBtu, the calendar 2026 strip averages $1.00/MMBtu higher, at $4.36/MMBtu, the calendar 2027 strip averages around $4.00/MMBtu and the curve remains backwardated (i.e. below the current spot price) into the mid-2030s. Based on the demand assumptions listed above, this implies enough supply will come online over the next two years to cap prices, on average, below $4.50/MMBtu and drive them even lower.
This supply response suggests a robust supply elasticity, much more so than what is currently assumed in G2M2. RBAC is not making a call on whether this is right or wrong. In fact, RBAC specifically develops its simulation systems to allow users the flexibility to modify assumptions as they see fit. However, if the supply elasticity assumptions in G2M2 are reasonably accurate, then significant opportunities may exist to capture the difference between the CME forward curve and what G2M2 expects prices to be.
There still appears to be evidence of drilling and completion-cost inflation, whether they are part of the tariff battles or not. Similarly, though the regulatory environment has shifted favorably for the fossil fuel industry, it’s still not certain that pipeline egress capacity can be added everywhere. Furthermore, questions are surfacing about how many top-tier drilling locations remain in places like the Permian and Haynesville when demands for investor returns remain high, especially in a low $60/Bbl oil or $4/MMBtu gas price environment. One should not discount these demands and their impacts on cash flow, returns and CapEx allocations, all of which filter back into required rates of return and break-evens. As an example, use your favorite AI tool (and help support the gas-for-power demand) to see what it suggests Saudi Arabia needs oil prices to be to meet their budget requirements. Hint, it’s not below $70/Bbl.
RBAC builds and licenses simulation systems such as GPCM and G2M2 to help the energy industry make optimal economic decisions. A great approach to achieving this is when our model users execute a variety of scenarios, creating a distribution of outcomes and overlaying their assessment of each scenario’s likelihood. This approach not only builds confidence, but it also allows for measurable risk assessments, contingency planning, and increasing the likelihood for positively skewed returns.
Contact us here for more information and to schedule a free demonstration.
RBAC is the market-leading supplier of global and regional gas and LNG market simulation systems used by the energy industry and related government agencies for over two decades. The GPCM® Market Simulator for North American Gas and LNG™ is the most widely used natural gas market simulation system in North America. RBAC’s G2M2® Market Simulator for Global Gas and LNG™ has been instrumental in understanding evolving global gas and LNG market dynamics and is vital to fully grasp and leverage the interrelationship between the North American and global gas markets.