May you live in interesting times. Wikipedia suggests this is “an English expression that purports to a translation of a traditional Chinese curse”; seemingly a blessing but with ironic overtones. How true this proverb is and how interesting the current times are, if interesting is even the appropriate adjective. Since our last quarter’s outlook, we have seen:
- OPEC+ come to terms on an extended production curtailment agreement
- Crude oil prices rebounding in excess of $40/Barrel (Bbl)
- Natural gas prices trade below $1.50/MMBtu
- Numerous energy company bankruptcies, including the former fracking pioneer, Chesapeake
- Sizeable acquisitions including Berkshire-Hathaway buying a large portion of Dominion’s midstream assets and NRG doing the same with Direct Energy/Centrica
- Trillions of dollars of stimulus pumped into the US economy
- COVID-19 lockdowns followed by phased re-openings followed by some re-establishment of lockdowns
This is not an exhaustive list, but it does provide a summary perspective of the depth of activity currently impacting the energy markets. By no means is the energy industry, nor the entire global economy for that matter, out of the woods yet. Equities markets may be indicating a “V” shaped recovery and some economic metrics (rebounding manufacturing indices, durable goods orders, less severe unemployment rates than forecast) appear to have buttressed the strong economic rebound thesis. But the glass could be half full, or it could be half empty, perspective matters! However, as phased re-openings have stymied, the unemployment rate, remote working, and any future mandatory lockdowns will be key metrics in determining further rebound potential and sustainability.
As noted in RBAC’s 20Q1 outlook, COVID-19 impacts on energy markets fell hardest on transportation fuel demand, and this is still the case. Industrial natural gas demand and LNG exports have experienced the largest sectoral declines. Refinery and petrochemical utilization rates are still below seasonal averages as demand for gasoline, distillates and jet fuel remain subpar. Industrial demand will likely remain depressed for some time due to lower GDP expectations and lower demand for transportation fuels in general.
Declines in commercial natural gas use have been partially offset by gains in residential consumption. There are less people in the office as they work from home, and remote working is gaining additional traction with many companies adjusting to this new normal by extending remote working allowances.
The reductions to electricity demand have been modest relative to transportation fuel demand. RTOs/ISOs are reporting overall weather-adjusted energy demand to be about 5-10% lower due to the pandemic. Only a portion of this reduction has fallen on gas-fired power generation demand because very low natural gas prices have increased the competitiveness of gas as a fuel for power generation.
Figure 1. EIA Covid-19 Consumption Impacts
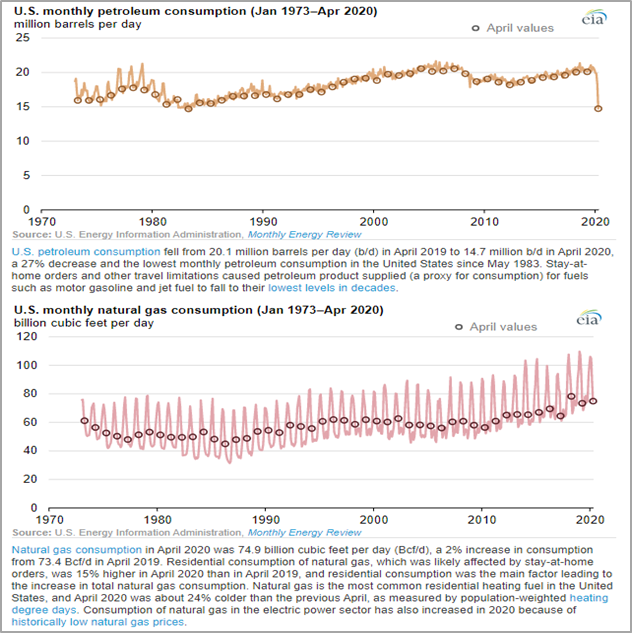
Source: https://www.eia.gov/todayinenergy/detail.php?id=44556
With crude oil rebounding and apparently stabilizing around $40/Bbl, the supply side question for natural gas is will this level be sufficient to stimulate enough production to meet demand as things return to normal? If not, then how elastic is supply in the more gas-centric basins such as the Haynesville and Marcellus shale plays? A major consideration is when will “normal” demand conditions return as well as what will “normal” look like?
RBAC’s 20Q2 perspective is that the drier gas basins are quite elastic and will respond rapidly when gas prices exceed $3.00/MMBtu. History supports this view. For example, average annual prices at Dominion South have not exceeded $3.00/MMBtu since 2014, and, since 2014, average Henry Hub prices only exceeded $3.00/MMBtu in 2018. Yet, Haynesville Shale production has increased from 4.5 Bcf/d in January 2015 to over 12 Bcf/d by early 2020, a 167% increase. Similarly, Marcellus production increased from 15 Bcf/d to 24 Bcf/d during the same timeframe, an increase of 60%. In addition, our internal economic modeling, research from 3rd party data vendors, and conversations with large E&P producers clearly demonstrates that the resource base remains prolific. It merely needs appropriate price levels to incentivize capital deployment. Given the heightened scrutiny on free cash flow and more stringent financing terms, the return hurdle rates are higher, e.g. IRRs closer to 20-30% vs 10%. Nevertheless, at $3.00/MMBtu, there are ample drilling opportunities that will lead to resumption of production growth. As such, though 2020 sees a slight production decline from 112.1 Bcf/d to 111.7 Bcf/d in our 20Q2 outlook, production growth resumes in 2021 and starts to accelerate in 2023 as prices hover around $3.00/MMBtu.
Figure 2. North American Dry Production (MMcf/d)
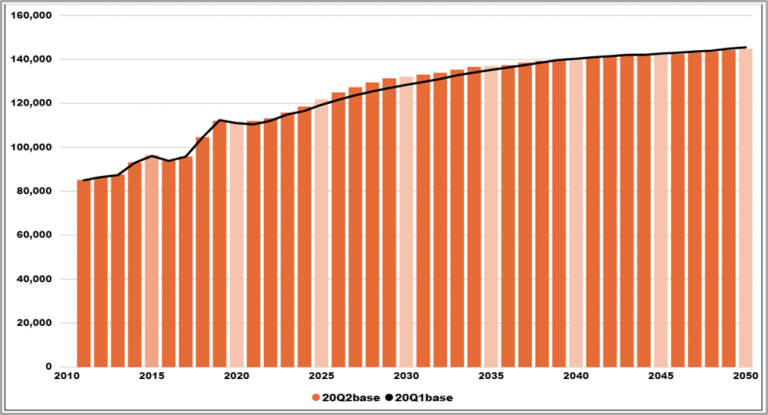
One promising aspect of price downturns and the COVID-19 issue is that energy companies are again forced to increase operational and economic efficiency. Recently, during FERC’s Technical Conference regarding Impacts of COVID-19 on the Energy Industry, EQT’s CEO Toby Rice discussed the Marcellus shale’s pent up supply that would quickly respond once gas prices approached $3.00/MMBtu. Similarly, producers in the Haynesville shale are seeing lower break-evens and interestingly, a wet gas layer on the East Texas side in Panola county. As such, RBAC’s 20Q2 outlook sees supply growth driven by the Haynesville and Marcellus shale plays, the former averaging 1.4 Bcf/d higher during the 2021 – 2030 period versus 20Q1 outlook and the latter 2.0 Bcf/d higher during the same period.
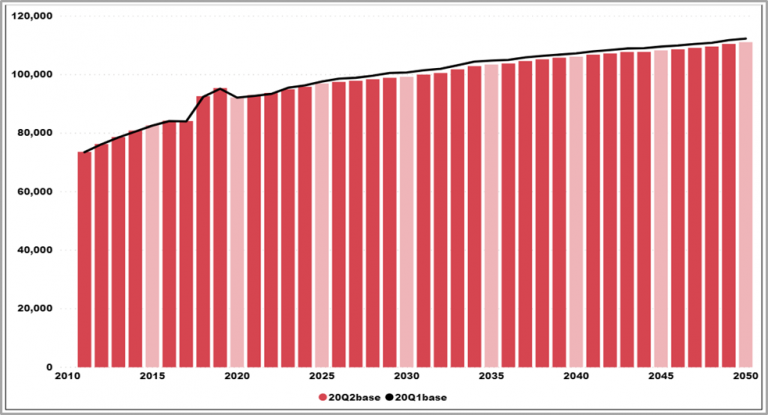
RBAC’s 20Q2 outlook consumption forecast trends slightly lower than the 20Q1 beginning in 2023, after the initial post-pandemic rebound to normal phase. The lower growth reflects the economic downturn and expectations that more remote working will persist going forward, which will lead to slight reductions in residential, commercial, and electricity demand and more pronounced reductions in industrial demand.
Figure 3. North American Natural Gas Consumption (MMcf/d)
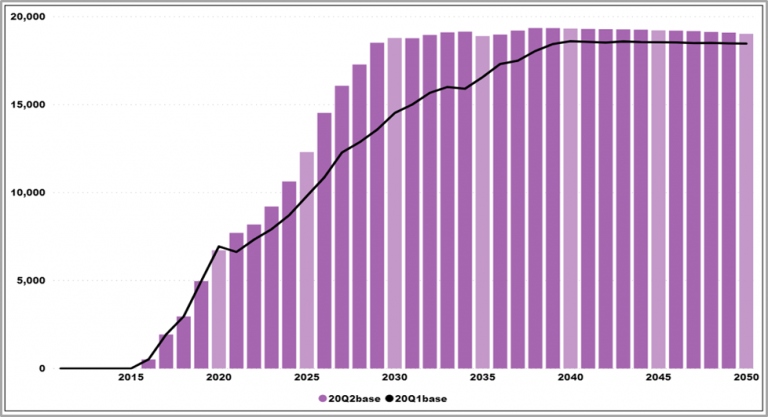
Global gas markets are expected to find their footing in 2021 and increased global demand will lead to an increased call on US LNG exports which are forecast to average 7.7 Bcf/d, approximately 17% higher than the 6.6 Bcf/d forecast in the 20Q1 outlook. LNG export growth maintains a robust trajectory through 2030, creating enough demand to support higher Henry Hub prices and correspondingly provoking increased E&P activity and increased production. By 2030, LNG exports are projected to reach nearly 19.0 Bcf/d and remain around this level through 2050.
Figure 4. LNG Exports (MMcf/)
Assuming average weather during the 2020-21 winter period, coupled with modest LNG exports, prices are forecast to rebound strongly to $2.70/MMBtu. Prices continue to rise throughout 2021 with an initial peak in Jan 2022 at $3.36/MMBtu, 20 cents lower than the 20Q1 outlook. A brief pull back is seen during the summer 2022 season before prices rally again heading into the 2022-23 winter, peaking this time at $3.59/MMBtu, essentially even with the 20Q1 outlook. Again, the higher LNG exports provide an elevated floor for Henry Hub prices which remain around the $3.00/MMBtu level, a critical level to support production growth.
Figure 5. Monthly Henry Hub Price Comparison (Real US$/MMbtu)
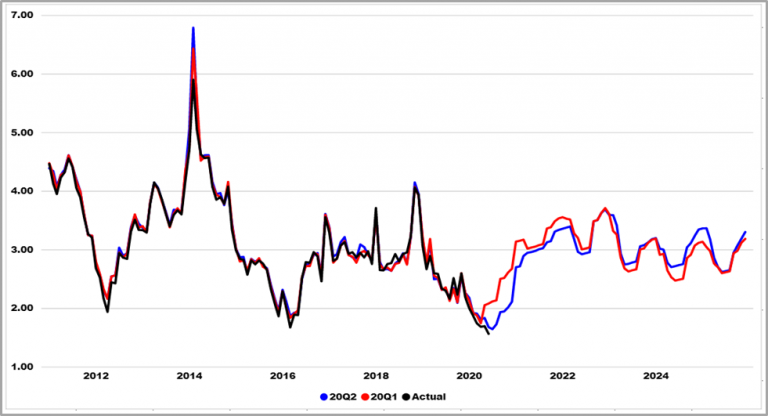
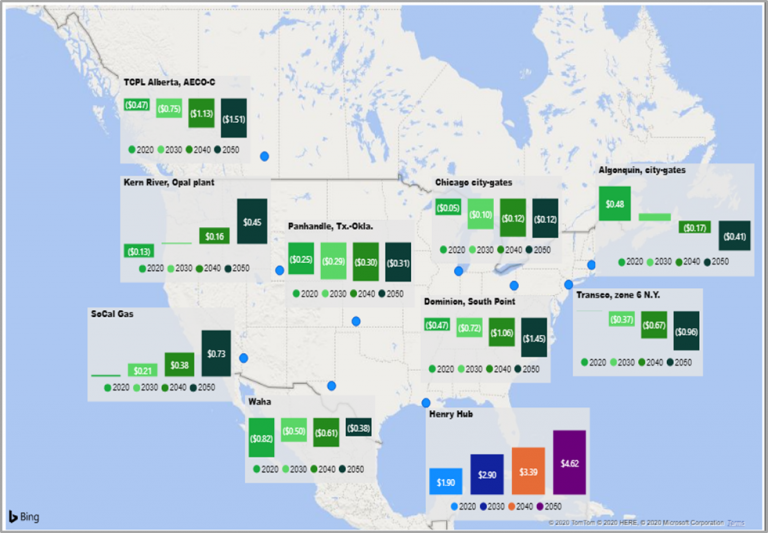
Figure 6. Yearly Basis 2020/2030/2040/2050
The COVID-19 pandemic has created substantial global market uncertainty and the energy industry has not been spared. Continued cost cutting, efficiency extraction, consolidation, and widespread bankruptcies are expected. US domestic producers are resilient and are expected to overcome these challenges and likely emerge in a better, more competitive position. RBAC’s 20Q2 outlook reflects this perspective and conveys the importance of North American energy resources in helping to balance global supply and demand dynamics.
RBAC’s GPCM® Natural Gas Market Forecasting System™ is used to produce RBAC’s quarterly natural gas outlooks. GPCM’s robust modeling capabilities are well suited for simulating market conditions during the “interesting times” that the energy industry is currently experiencing. Users have enormous flexibility in modifying supply, demand and infrastructure assumptions to help assess market risk and opportunities, thus leading to better informed and more optimal decisions.
RBAC, Inc. has been the leading provider of market fundamental analysis tools used by the energy industry and related government agencies for the past two decades. The GPCM® Natural Gas Market Forecasting System™ is the most widely used natural gas market modeling system in North America. RBAC’s G2M2® Global Gas Marketing Modeling System™ has been instrumental in understanding evolving global gas and LNG dynamics and is vital in fully understanding the interrelationship between the North American and global gas markets. For more information visit RBAC’s website at http://www.rbac.com or call James Brooks (281) 506-0588 ext. 126.