
Marcellus. A Natural gas deposit (a “shale play”) running through Virginia, Kentucky, Maryland and especially West Virginia, Ohio, Pennsylvania and even extending to New York. A stone’s throw from Albany, a short drive from Hartford, over the hills and not too far away from Boston and Providence. How can New England be in an energy crisis again, being right next to some of the most prolific natural gas deposits on Earth?
A Political Tune Full of Flat Notes
Well, summoning a much-overused slogan, “Never let a good crisis go to waste,” politicians often jump at publicity opportunities whenever “crisis” events occur, especially when the “corporate greed” cliché can be deployed. In the current high inflationary environment, with crude oil hitting $100/Bbl and natural gas prices $5.00/MMBtu – and much higher regional and cash prices on peak demand days – the trumpets are once again blowing the tune of “corporate greed,” clamoring to shut down LNG exports, and every other political discord one can imagine.
Fortunately, there are real solutions and opportunities to demonstrate how competition and infrastructure enhancements play a significant role in balancing supply and demand, and thus prices. All based on hard data, historically calibrated systems, and rigorous analysis.
Testing the Northeast Pipeline Constraint with Market Simulation
We used one of these systems[1], the GPCM Market Simulator for North American Gas and LNG and the latest database update (21Q4base, released January 2022), to construct scenarios focusing on the New England and Mid-Atlantic regions. The objective was to examine the impacts of the current stringent regulatory environment inhibitive of pipeline expansions versus a regime more favorable to enhancements in infrastructure.
To establish our “base case,” we assumed a cold weather forecast using monthly state Heating Degree Days (HDDs) from 2014 (a fairly cold year) that were held constant for the forecast period 2022 through 2030. Having executed this base case, the next scenario assumed a less stringent regulatory regime that allowed for pipeline expansions in both the New England and Mid-Atlantic regions starting in November 2023.
A unique feature within the GPCM simulator is the ability to automatically expand pipeline capacity should economic hurdles be met. The “auto-expand” feature, which can be turned on or off at the pipeline level, also allows users to choose when and by how much pipelines can start expanding. For the last few years, RBAC’s quarterly releases have turned off this capability for pipelines that serve New England and have increased the economic hurdle for most pipelines in the Mid-Atlantic region. This more stringent regulatory assumption was included in the base case – represented by the blue color line in Figure 1 below, “21Q4baseSTColdWx2014.”
Figure 1 – Demand Markets Price Comparisons (Real US$/MMBtu)
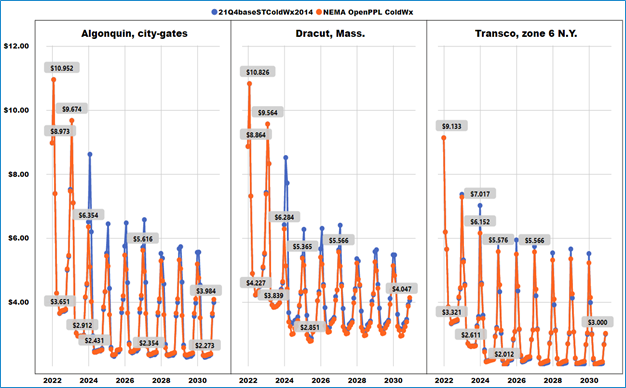
A more favorable-regulatory-atmosphere scenario turns on auto-expand for all pipelines in New England and Mid-Atlantic regions, lowers the economic hurdle, allows expansions to start in November 2023, and allows for more aggressive expansion quantities. This is a very aggressive scenario as it implies midstream companies would start deploying capital and work immediately to put expansions in place by the 2023 – 24 winter season.
Infrastructure Expansion and the Price Impact
The result is highly illustrative. Prices are dramatically lower for demand areas. For example, New York sees 14% lower prices in January 2024, while Algonquin and Dracut see drastically lower prices in February 2024, 70% and 65% lower respectively (orange color line, Figure 1 above, “NEMA OpenPPL ColdWx”).
It’s also worth noting the higher prices seen in the winters prior to pipeline capacity expansions, i.e., pre-November 2023. Though unlikely these expansions could occur and be ready for the 2022 – 23 winter season, it would be reasonable to expect that these higher prices would be dampened if more capacity were then available.
Most natural gas market participants are fully aware of and appreciate the price volatility that exists, especially in the winter and even more so in daily cash market trading. GPCM is a monthly model, so the larger, more volatile intra-month cash market price impacts are diminished. However, it is easy to infer that similar, or larger, price reductions due to greater availability of pipeline capacity would be seen intra-month – we will be working on our daily GPCM model and similar scenarios soon, so stayed tuned.
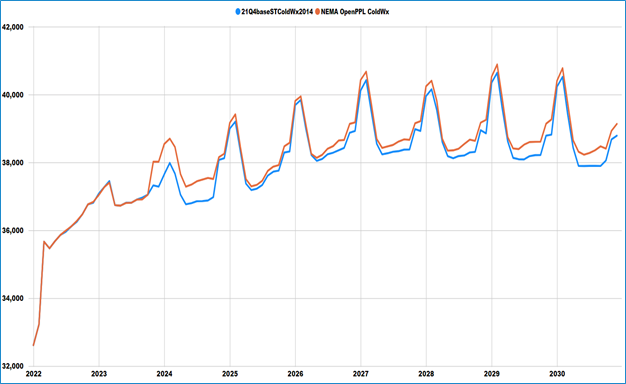
Another interesting result from this “infrastructure favorable” scenario is the increase in production from the Appalachian Basin (Figure 2). With more pipeline capacity starting up in late 2023, the Marcellus and Utica now have access to more takeaway capacity, which these plays are very willing to fill up.
The “stringent regulatory atmosphere” in our base case does allow for some pipelines to auto-expand but not until November 2024, and at a less aggressive pace, and only if a higher economic hurdle is achieved.
The resource base potential for these plays is unquestioned; however, the constraints are directly related to takeaway capacity, or the potential thereof.
Figure 2 – Appalachian Basin Production (MMcf/d)
What the Results Mean for Consumers and Power Prices
So, what does all this mean for the consumer’s bottom line?
Let’s take the case of Algonquin city-gate prices, which represents gas delivered to eastern Massachusetts. Assuming gas demand stayed constant at 2021 levels as reported by EIA, the lower Algonquin price[2] resulting from a conducive regulatory environment would reduce gas costs by nearly $300MM in 2024. From 2025 forward, the annual saving ranges from $82MM to $126MM or an average of over $102MM, annually. Lower gas prices also impact electricity costs. As an example, assuming a 7.5 MMBtu/MW-hr heat rate (a very efficient power generation unit), wholesale electricity prices would be more than $26/MW-hr lower in February 2024 and over $16/MW-hr lower in March 2024. At a 10.0 MMBtu/MW-hr heat rate, these savings increase to more than $35/MW-hr and $21/MW-hr, respectively.
In future scenarios we’ll address the Jones Act and how relaxing restrictions on vessel mandates would impact regional supply/demand balances and thus prices but for now, it’s obvious that allowing more pipeline infrastructure to be built, would provide significant price relief to consumers. Moreover, it’s been well documented how lower energy prices incentivize economic growth which leads to higher employment, a broader tax base and higher tax revenues. Clearly the political “corporate greed” tune is full of flat notes, and the true melodic sound is grounded in market fundamentals.
Concrete analytics and robust market simulations clearly demonstrate that competition and infrastructure development dramatically impact consumer costs. A more rigorous policy and cost/benefit analysis, prior to regulatory passage and implementation could significantly increase consumer benefit. Surely, consumers would much prefer cozy warmth and the sweet sound of savings – and add to that more robust economic growth!
[1] RBAC has several market simulation systems: GPCM® for North America and regional and G2M2® Market Simulator for Global Gas and LNG. For more info see https://rbac.com/products-and-services/
[2] Ignoring price elasticity implications and assuming that 2021 demand held constant through 2030 (approx. 381 Bcf/Year, per EIA data assuming December 2021 demand equals December 2020 demand).