The Covid-19 pandemic has led to dramatic shifts in lifestyles, business operations and energy utilization. With the implementation of mandated lockdowns, unemployment increased substantially as did remote working, for those jobs and businesses that were capable of such operations. This created a shift from commercial to residential energy demand while also adversely impacting industrial and transportation demand, and to a lesser extent, power generation demand.
As lockdown mandates were lifted, demand rebounded significantly, though not to pre-pandemic levels. This is especially true for the transportation demand sector with jet fuel demand still languishing as airline travel continues to stall. Likewise, distillate and motor gasoline demand remain subpar compared to previous years. However, as the economy has started to regain its footing, demand for product movements has increased diesel demand, and people have started to head back to the office and take road trips, thereby increasing motor gasoline demand.
Figure 1. Pandemic Impacts on Refined Produced Consumption
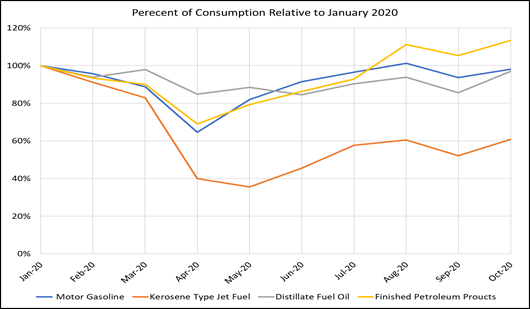
Source: Energy Information Administration
Natural gas demand has fared much better with shifts from commercial to residential demand actually resulting in a combined, net year-on-year (YoY) gain during April of 7%, an even comparison for May, and only slight decreases of -2% and -3% for June and July, respectively – all non-weather adjusted, EIA data. Unsurprisingly, industrial natural gas demand has seen the most significant negative impact with demand dropping YoY by -5% in April, -7% in May, -4% in June, before recovering to only -1% lower in July. Power generation demand has fared the best overall seeing gains of 4% in April, flat in May, 5% increase in June and an 8% gain in July.
Figure 2. April thru July Year-On-Year Gas Demand Comparisons
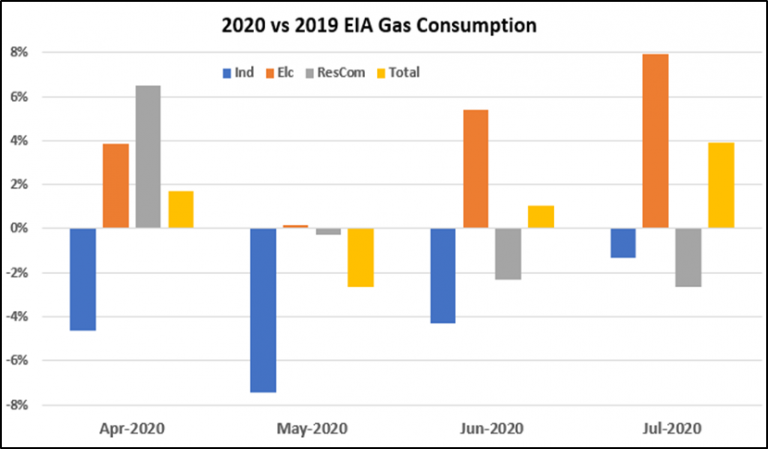
Source: Energy Information Administration
With winter right around the corner, hurricane season hopefully drawing to conclusion, and natural gas having rallied to over $3.00/MMBtu, is the market truly shifting to a tighter supply/demand balance and if so, for how long?
As anyone taking a reasonably long road trip with kids knows, the inevitable question must be asked, “Are we there yet?”
RBAC’s 20Q3base release provides insights to these questions. The 20Q3base forecasts a more rapid demand rebound than the 20Q2base, and this is supported by the most recent data published by the EIA. The current trends of shifting demand from commercial to residential are expected to continue for the next year or two, as remote working remains in place.
The faster than expected recovery in the industrial sector is responsible for much of the higher demand outlook relative to the prior quarter. Leading/contemporaneous indicators like the Chemical Activity Barometer continue to increase – signifying positive future Industrial Production metrics. As such, the 20Q3 forecast shows higher industrial gas demand starting in 2020, which accelerates more quickly through 2025 when compared to the 20Q2base forecast.
Natural gas consumed for power generation is expected to experience modest gains compared to the previous 20Q2 forecast through the mid-2030’s. This is due primarily to a lower price forecast which incentivizes higher gas burns. However, as prices start to increase beyond 2035, the demand forecast flips to a deficit relative to 20Q2. It is important to note that the current power generation demand scenario is based on EIA’s AEO forecast which assumes significant renewable penetration. There is the potential for considerable near-term federal and state environmental policy changes that could reduce the outlook for natural gas demand. While 20Q3base does not assume major policy changes, such a scenario can readily be constructed in GPCM.
Finally, to conclude the demand side of the equation, LNG exports follow a similar trajectory as found in the 20Q2 forecast. Now that hurricane season appears to be ending, export terminals are returning to service, and the arbs are open. Although, Hurricane “Zeta” hit the Louisiana Gulf Coast and has some short-impact to LNG operations. 20Q3 expects exports in the 7.5 to 8.2 Bcf/d range through the winter with further gains occurring in 2022 before maxing out around 19 Bcf/d in 2030.
Figure 3. LNG Exports (MMcf/d)
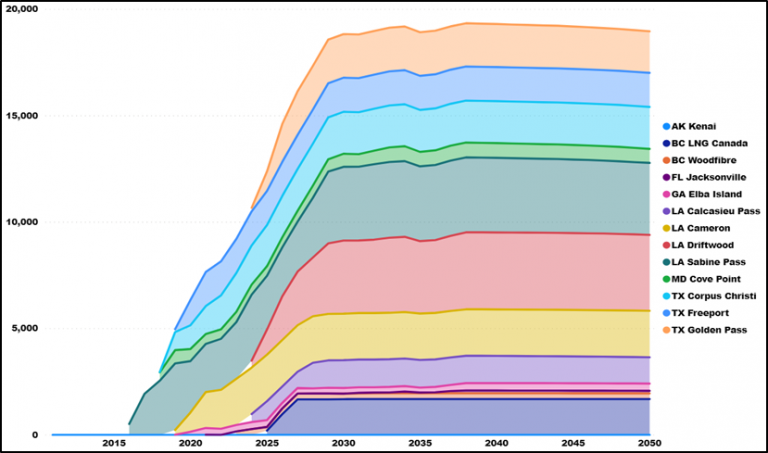
Source: GPCM
What the Covid-19 pandemic has demonstrated is that the “demand pull” is as important as the “supply push”. U.S. production has fared reasonably well so far, and it appears that the pandemic exogenous shock to natural gas markets is only temporary. Should this truly be the case, then the next question becomes how quickly will U.S. production ramp back up, especially considering producers’ adherence to more stringent financial requirements from investors. Similarly, with a stronger push for green energy, and the consolidation among producers and midstream companies that is underway, what implications will this have not only on production but also on pipeline, LNG terminal, and other infrastructure FIDs?
To better simulate this environment, the 20Q3 release incorporates both a higher economic hurdle for GPCM’s auto expand feature; and for some states, the feature is turned “off”. This feature is used to model potential requirements for additional capacity along existing pipeline routes due to possible changes in market supply and demand conditions. Dominion’s recent asset sale to Berkshire Hathaway and the implications on the Atlantic Coast Pipeline project is an example of the increasingly difficult regulatory environment – the abandonment of the ACP project results in billions of dollars in sunk costs that will not be recouped.
Implementation of these new assumptions impacts not just flows, but also supply and prices. Areas closer to LNG export terminals also happen to be areas that experience more favorable regulatory environments and thus, supply from these regions benefits. This includes areas such as the Haynesville shale in East Texas and North Louisiana as well as the Eagle Ford shale along the Texas Gulf Coast and south Texas. Similarly, the crude oil price rebound and stabilization around $40/barrel, along with lower costs and utilization of DuCs (drilled but uncompleted wells) has provided producers the ability to ramp up production more quickly than previously anticipated. As such, 20Q3 forecasts U.S. production around 93.5 Bcf/d in 2021, increasing to 94.8 in 2022, and accelerating in 2023 to 2026, where production reaches 105.3.
Figure 4. US Dry Gas Production (MMcf/d)
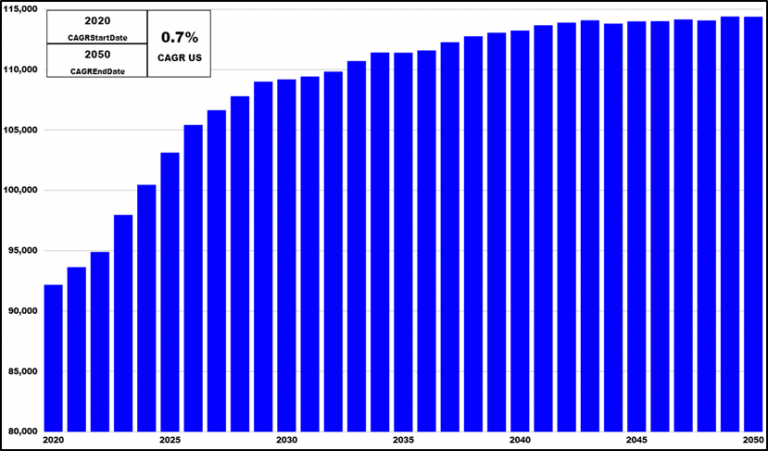
Source: GPCM
An important assumption in this forecast is LNG exports ramping toward 12.5 Bcf/d and U.S. end-use sector demand exceeding 79 Bcf/d in 2026. Should demand or LNG exports fall short, the demand pull could revert quite quickly back to a supply push situation and prices will decline. For now, the rapid gas demand recovery combined with strong 3Q20 GDP data from China (+4.9%) and the U.S. (which registered an unprecedented 33.1%, annualized), likely indicate continued global demand growth and thus strong LNG exports. The 20Q3 forecast expects North American natural gas demand growth to continue on a steady growth trajectory, slightly exceeding the 20Q2 forecast in the near to medium term.
Figure 5. North American Natural Gas Consumption (MMcf/d)
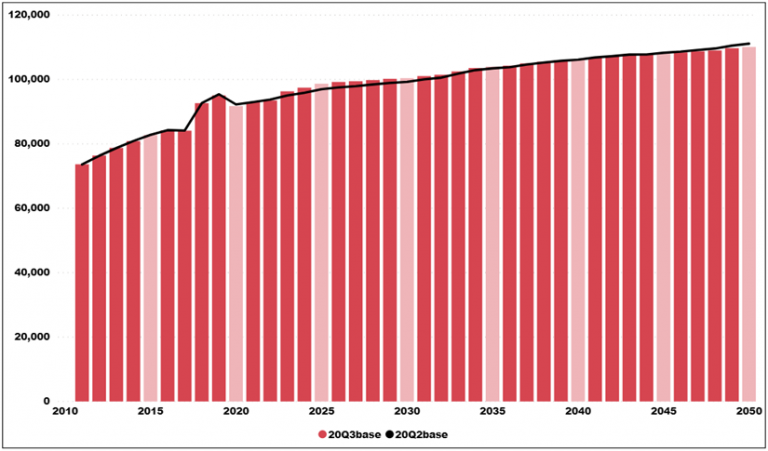
Source: GPCM
Assuming average weather during the 2020-21 winter period, coupled with modest LNG exports, prices are forecast to rebound strongly to approximately $3.10/MMBtu by January 2021, before pulling back toward $2.80/MMBtu as summer 2021 approaches. Prices are then expected to continue to rise throughout 2021, peaking near $3.70/MMBtu in January 2022, more than 30 cents higher than the 20Q2base. A similar brief pull-back then rally pattern is seen during the summer 2022 and into winter 2022/23 season with prices bottoming around $3.20/MMBtu and peaking just over $3.60/MMBtu. As more supply comes online due to prices exceeding $3.00/MMBtu, supply/demand balances loosen, and prices move lower into the $2.50 – $2.90/MMBtu range for the next several years. It’s not until 2033 before prices again breach the $3.00/MMBtu level and by 2035, supply/demand balances tighten enough to sustain levels above $3.00/MMBtu.
Figure 6. Monthly Henry Hub Price Comparison (Real US$/MMbtu)
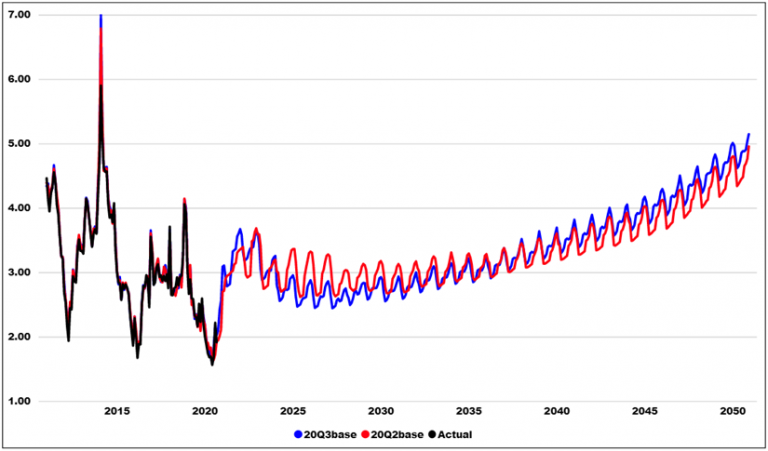
Source: GPCM
Figure 7. Yearly Basis 2025/2035/2045/2050 (Real US$/MMbtu)
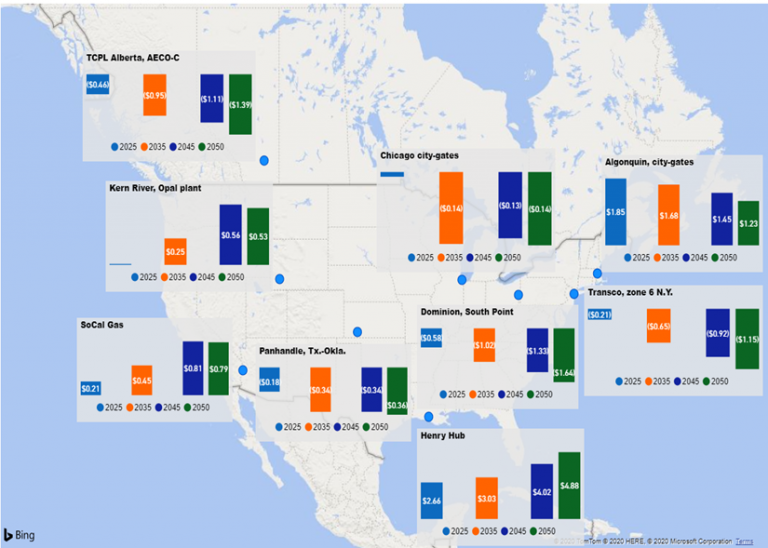
Source: GPCM
Currently, the pandemic’s potential to flare back up is presenting itself as the Northern Hemisphere moves toward the winter season, so the short-term risks seem to be associated with the likelihood of re-establishing lockdown mandates. Longer term, the risk for gas demand, and fossil fuels in general, seem to reside in the regulatory arena and how quickly and forcibly green mandates might be implemented.
The implications for both short and long-term supply/demand balances will be significantly impacted by any potential lockdown redux and/or stricter, greener environmental mandates. Both scenarios can easily be constructed and analyzed using RBAC’s GPCM® and G2M2® modeling systems.
RBAC’s GPCM® Natural Gas Market Forecasting System™ is used to produce RBAC’s quarterly natural gas outlooks. GPCM’s robust modeling capabilities are well suited for simulating market conditions during the “interesting times” that the energy industry is currently experiencing. Users have enormous flexibility in modifying supply, demand and infrastructure assumptions to help assess market risk and opportunities, thus leading to better informed and more optimal decisions.
RBAC, Inc. has been the leading provider of market fundamental analysis tools used by the energy industry and related government agencies for the past two decades. The GPCM® Natural Gas Market Forecasting System™ is the most widely used natural gas market modeling system in North America. RBAC’s G2M2® Global Gas Market Modeling System™ has been instrumental in understanding evolving global gas and LNG dynamics and is vital in fully understanding the interrelationship between the North American and global gas markets. For more information visit RBAC’s website at http://www.rbac.com or call James Brooks (281) 506-0588 ext. 126.