



Introduction
Energía Costa Azul LNG provides a new Pacific Coast outlet for U.S. natural gas. Located near Ensenada, Baja California, the facility gives exporters a shorter route to Asian markets while avoiding the Panama Canal. Its delayed startup raises several questions on the outage’s impact to supply, demand, and exports in the U.S. and Mexico.
Project Background and Outage
Costa Azul Phase 1 reached final investment decision in November 2020, with first LNG production originally expected in late 2024. After several delays, Sempra Infrastructure announced first LNG production in June 2026 and its first cargo on July 8, 2026. Developed with TotalEnergies, the facility has 3.25 million tons per annum (Mtpa) of nameplate capacity, equivalent to approximately 0.4 Bcf/d of LNG exports. A potential Phase 2 of the project would add another 12 Mpta, or 1.6 Bcf/d, of export capacity.
On July 27, Sempra announced an extension of commissioning after planned inspections identified damage to refrigerant compressors. An October filing described repairs involving the warm and cold mixed refrigerant systems, including turbines and compressors, along with boil-off gas compressors. The filing estimated exports would restart in Q4 2026 following repairs and performance testing.
Scenario and Outcomes
Given the interest in Costa Azul, we decided to explore two different scenarios for the facility’s ramp up. The first scenario, and the one present in our 26Q3 Base case, has Costa Azul exporting a small amount of LNG in July 2026, and then stalling until January of 2027, consistent with reporting we’ve seen on the facility’s repairs. The second scenario models a more delayed case, in which repairs take longer than anticipated and the facility doesn’t ramp up again until July 2027. This scenario keeps in mind some of the recent incidents with Freeport LNG facility outages and the lengths thereof.
For our analysis, feedgas deliveries and sustained LNG production are separate. Gas entering the facility during commissioning does not mean the plant is producing LNG at a consistent rate. Pipeline feedgas requirements also include fuel consumption and process losses, making them different from LNG export volumes.
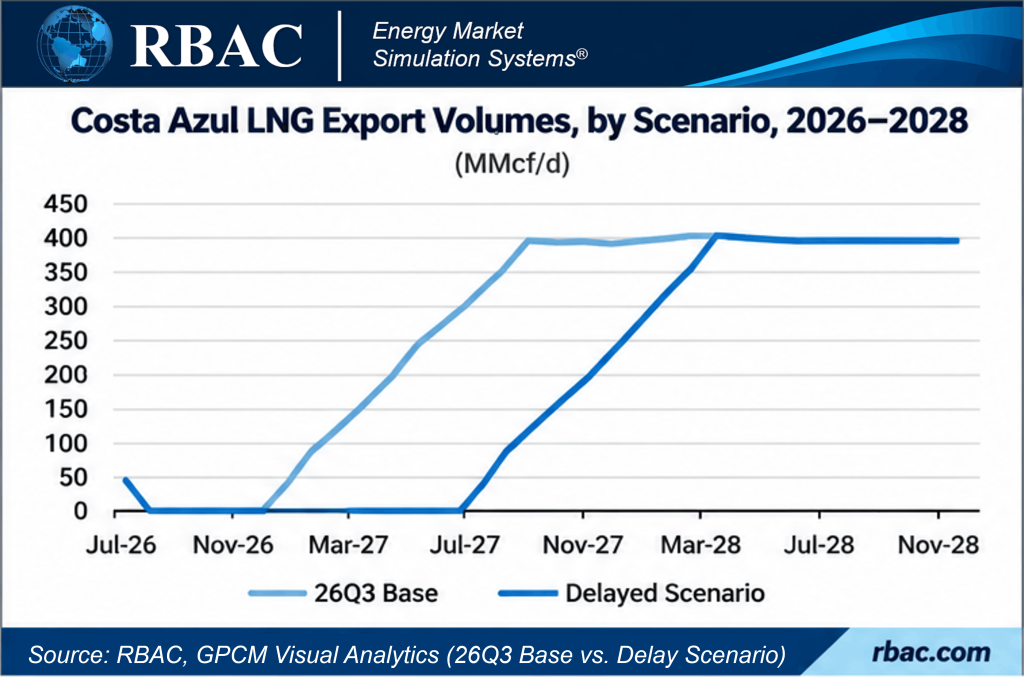
Figure 1 clearly displays the different ramp up schedules present in the two scenarios. In our 26Q3 base case, exports pause from August to January 2027 and then increase to reach near the facility’s capacity of 385.5 MMcf/d in October of 2027. In the delayed scenario, this increase is shifted by 6 months, with peak capacity achieved in May of 2028. In both cases, the Costa Azul exports between 370 – 390 MMcf/d for the remainder of the scenario, reflecting a high utilization rate (around 90%) and increasing demand from the markets it was constructed to serve.
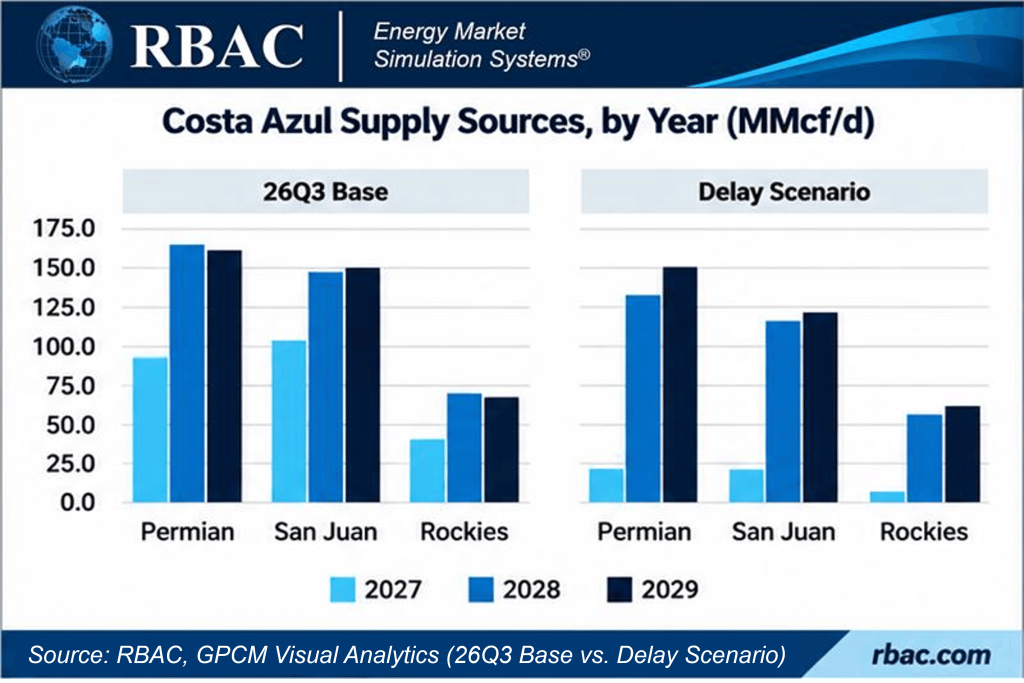
Using GPCM’s source destinations flows tool, we could also see exactly what supply – characterized by geography and geology – is providing gas to Costa Azul, and if a delay startup would change this at all. In this instance, the SDF report displays the key supply route that connects Costa Azul to U.S. natural gas supply.
In our Base case, the primary source of natural gas is from the Permian Basin, and specifically the Delaware play (~96.0 MMcf/d in 2027, and increasing to 162.0 MMcf/d, or over half, of the facility’s liquefaction capacity). Closely following that is supply from the San Juan Basin, which provides another 103.0 MMcf/d in 2027, and 147.7 MMcf/d by 2029. The remainder of the gas is sourced from the Rockies region and piped down across the border to the facility. Deliveries ramp up through the start-up period of the facility – for example, receipts from the Permian increase by 70% from 2027 to 2028 and then remain mostly constant from 2028 to 2029.
The results of the SDF report indicate gas supplied to Costa Azul flows along its primary route, namely along El Paso Natural Gas to Ehrenberg, Arizona, then crosses into Mexico near Ogilby–Los Algodones and continues through Gasoducto Rosarito to Costa Azul. Additionally, El Paso also accesses the San Juan Basin and other supply regions, hence the flows exhibited in Figure 2. Which sources provide actual deliveries will depend on supply costs, available pipeline capacity, and competing demand.
Flows in the delayed scenario are similar, with the primary impact being lower flows in 2027 across all sources. Flows are again slightly less in 2028, as the facility continues its ramp up period, but are nearly identical to the Base case by 2029. During the delay, gas that would have supplied Costa Azul may serve other consumers, enter storage, or move through other export routes. Those alternatives depend on transportation capacity and market demand. If the gas cannot reach another destination, the adjustment could occur through lower upstream prices or reduced production.
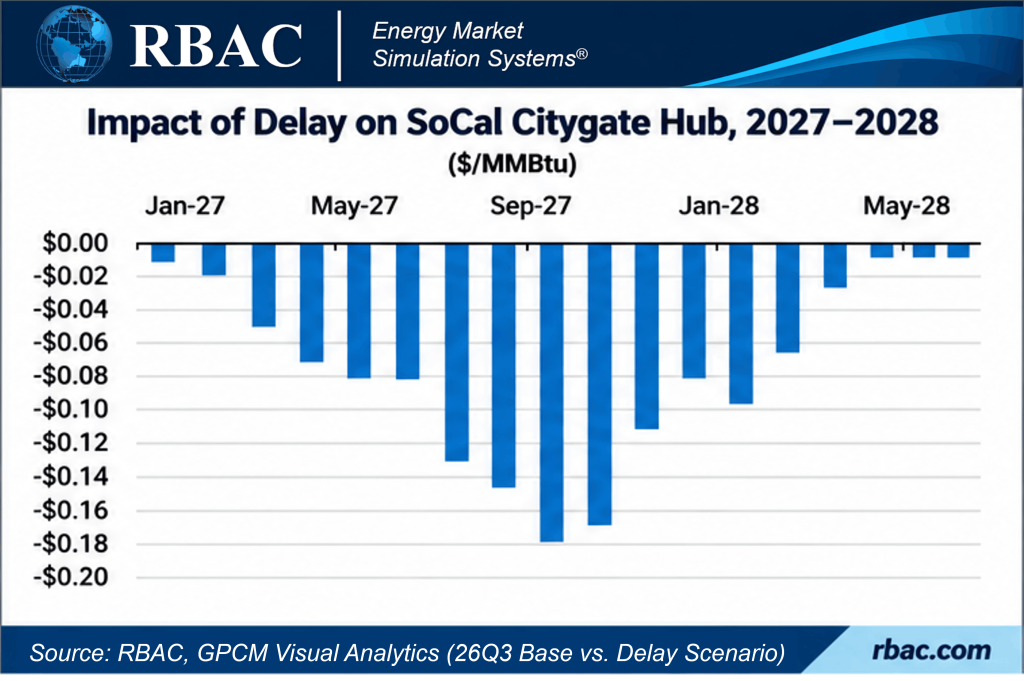
Figure 3 shows the impact of the delayed start on the SoCal Citygate hub, the pricing point closest to the Costa Azul export facility – and one of 200 market points available in GPCM for analysis. The bars represent the difference in prices between the 26Q3 Base and the Delay Scenario; for example, in Jan-2027, prices at the SoCal Citygate were a cent above those in the Delay Scenario.
Comparing the two scenarios, prices in the Base case are higher relative to the delayed scenario, with the difference increasing as Costa Azul comes online later in the Delay scenario. That basis decreases starting in September of 2027 (when the Costa Azul delayed facility comes online), and essentially flattens by May of 2028, clearly displaying the normalization of flows as the facility reaches commercial operations.
Conclusion
Although the demands, and price signals, eventually converge, we could have easily modeled a scenario where that wasn’t the case – say if Phase 2 of the Costa Azul reaches FID, if significant transportation capacity develops in the Permian to the Mexican northeast, or any number of scenarios.
Actual events rarely match forecasts exactly and history doesn’t repeat itself, but it often rhymes. Using scenario analysis to understand how markets move during disruptions allows analysts to derive actionable insights and create a plan for when the unforeseen occurs
RBAC, Inc. has been the leading provider of market fundamental analysis tools used by the energy industry and related government agencies for over two decades. The GPCM® Market Simulator for North American Gas and LNG™ is the most widely used natural gas market modeling system in North America. RBAC’s G2M2® Market Simulator for Global Gas and LNG™ has been instrumental in understanding evolving global gas and LNG dynamics and is vital in fully understanding the interrelationship between the North American and global gas markets.