Published January 1998 by Dr. Robert E. Brooks and Mr. Robert Ineson
One of the most important and complex problems faced by analysts seeking to project the future course of the natural gas industry flows from the fact that the business consists of trading a fungible commodity in a well-integrated, continental scale market. An understanding of the maddening subtleties of the displacement effects on the North American pipeline grid is difficult to achieve. However, such an understanding is a critical aspect of a forecasting effort.
For example, when Sable Island gas reaches the market in 1999, it will displace other gas. The result should be that prices in New England fall from where they would have been otherwise. What is the impact elsewhere? As the displaced gas competes to enter new markets, prices should fall there, also. This effect will ripple across the grid until a new equilibrium is achieved. It is a commonplace observation to say that a decrease in prices somewhere will ultimately become a decrease in prices everywhere. Other things being equal, gas-on-gas competition will see to that. The real questions are: how much, and where?
In 1997 RBAC, Inc. and Platts teamed up to develop an analytical tool, the GPCM® Natural Gas Market Forecasting System and Platts Base Case Database, which now enables users to assess these questions from their desktop. The system is based on linear programming (LP) technology, which is particularly well-suited to the analysis of network problems. Although LP technology has been used in the gas industry before, it has been used primarily to analyze short-run transportation pathing questions. These questions often require meter-by-meter detail. Due to the computing resources required, use tended to be limited to large-scale commercial applications. However, short-term meter-by-meter modeling is not that helpful in a strategic context.
The objective was to develop a system that was user-controlled. It was to be a strategic level model, but a model which could be expanded in particular areas as the need arose. It had to run – in a reasonable amount of time – on a personal computer (PC). Most importantly, it had to be able to capture the subtleties of the displacement effects that occur in an integrated pipeline system.
Development began in the summer of 1997. The system and the related data were complete and running by early October. The system played a key role in the development of the forecasts included in Platts’ study, The Convergence of Gas and Power: Causes and Consequences, which was released on December 24, 1997. Robert Ineson, Platts’ Principal of Natural Gas Consulting, served as Platts’ lead analyst on both the GPCM project and the convergence study.
Following is a description of the model’s structure and the related data set.
GPCM® System and Data Set
Overview
GPCM is the latest in a series of systems and models built by Dr. Robert E. Brooks, founder of RBAC, Inc., from the mid-1970s through the present. Whereas in the past similar software tools required the use of mainframe computers, this model runs on a PC in a Windows environment. Use of the latest PC hardware and software technology, as well as advanced computational algorithms, enables analysts to handle, at their desktop, the sort of detailed gas industry analysis previously beyond the scope of the individual.
GPCM is a combination software-database system, the purpose of which is to enable its users to build models for analysis of natural gas economics. The gas industry includes several clearly delineated sectors in its value chain. Sources of supply are located in areas remote from demand centers, and must be transported. Further, through the use of storage, gas produced in one time period is consumed in another. In order to capture the nuances of the interaction between these variables, the model includes the relevant sectors: production, transportation, storage, marketing, and sales to distributors and other large customers.
To populate the model, Platts developed a detailed data set. The data set included 107 transportation companies, 59 suppliers, 600 consumers, 98 storage facilities, 663 interconnects, 189 transport zones, 314 locations, and demand and supply functions, by month, for a ten-year forecast period.
Model Structure
Mathematically, GPCM is a network model. It can be diagrammed as a set of “nodes” and “arcs”. Nodes represent production regions, pipeline zones and interconnects, storage facilities, delivery points, and customers or customer groups. The connections between these nodes are called “arcs”. They represent transactions and flows. Some of these are supplier deliveries to pipelines, transportation across zones and from one zone to another, transfers of gas by one pipeline to another, delivery of gas into storage, storage of gas from one period to another, withdrawal of gas from storage, and pipeline deliveries of gas to customers.
In general an arc has four input attributes and two output attributes. The inputs are cost (which may depend on transaction volume), a minimum, a maximum, and a loss factor (representing fuel use and miscellaneous losses). The outputs are the amount of the transaction (the flow) and the economic rent associated with the flow. The latter is defined mathematically as the economic value of a unit increase (decrease) in the upper (lower) bound. It generally applies to pipeline transportation and storage capacity and represents the marginal value of increased capacity.
Matching nodes and arcs with geographic reality was one of the first methodological problems Brooks and Ineson dealt with, a problem that was solved in the data set design. Traditionally, LP models of the gas industry had been designed around a “satellite view” geographical concept. That is, the territory to be modeled consisted of a set of interlocking territories, and each node or arc was located in one of the territories. This made sense when looking at pipeline costs on a cents per mile basis. However, contemporary pipelines, particularly the long-line pipelines, structure their business on a zone concept. If the goal of the analyst is to analyze markets on a regional level, as opposed to on a meter-by-meter level, it makes sense to follow the lead of the pipelines and use the zone concept.
The solution was to abandon the “satellite view” in favor of a layer cake concept. Each segment of the industry – supply, transportation, distribution, and the market – has its own set of locations, and they need not be interlocking. Locations in the transportation segment were deemed to be the pipeline rate zones, and these overlap rather than interlock. Relations among the sectors are shown in Figure 1.
Location Relationships
FIGURE 1

Platts developed a set of pipeline and storage capacities and interconnections with which to populate the model based on analysis of data included in Platts’ GASdat Information System, FERC Form 567, state and federal production reports, and data furnished by the individual companies. Capacities at interconnects and transport links (links between zones on the same pipeline) were tightly specified, while zone capacity was specified based on non-coincident peak day volume. This scheme allowed for short-haul transmission while keeping the interregional flows appropriately constrained.
Once the physical constraints have been specified, the system can derive a solution given a set of supply and demand conditions. The economic value of a solution to this problem is identified in economic theory to be the sum of producer and consumer surplus. These concepts are defined for price sensitive supplies and demands. We assume that each supply source and each customer has a well-defined supply or demand curve. The forms for these curves can be quite general. GPCM™ only requires the quantity to decrease with increasing price for demand curves and to increase with increasing price for supply curves.
The objective function for this “equilibrium” solution has been shown by Nobel Prize winning economist Paul Samuelson to consist of three terms: the integral of the demand price function over demand minus the integral of the supply price function over supply and minus the sum of the transportation and storage costs. By dividing the applicable range of possible prices into a number of small steps, we can approximate the integrals in the objective function by linear terms of the form p * delta q, where delta q is the additional demand (or supply) resulting from the small price change. Because of the form of the supply and demand functions and the objective function, each of these terms will be brought into the solution in an economically sensible order to produce an economically efficient result. That is, the cheaper supplies will be used before more expensive ones and the customers willing to pay more will be served before those willing to pay less. Thus we are able to use an LP approach to solve a highly non-linear, complex model of market clearing behavior in the natural gas industry.
Platts developed a set of supply and demand curves for the model based on the data sources indicated above. The basic methodology was to develop appropriate long-term forecasts using standard econometric methods.
Supply was generally specified at a state level, except for states like Texas and Louisiana and the offshore area. The analysis considered the usual economic variables: the rig count, the impact of technology, historical reaction to price changes, and so on. For Platts’ initial purpose, a study focused on end-use markets, this was an appropriate level of summarization.
Demand was specified in greater detail. Demand curves for significant individual customers were developed, with smaller customers summarized. One key purpose of this approach was to enable the analysis team to match electric industry customers as specified in Platts’ power market model. This enabled the long-term electric industry demand for gas to be determined in the power market model, then translated and imported into GPCM.
Platts also estimated elasticities of supply and demand, again based on econometric methods.
Transportation and Storage Tariff Structure
One of the important changes which has occurred in over two decades of deregulation in the natural gas industry has been the introduction of free market principles into gas transmission and storage markets. Nonetheless, these markets are still subject to regulation. Hence, although the structure of the rates charged is known, the amount charged is not.
In general, each transportation and storage transaction cost is parameterized by six values: a unit demand charge, unit firm commodity charge, unit interruptible commodity charge, a “full discount quantity” (FDQ), a “zero discount quantity” (ZDQ), and a fuel and loss factor.
The cost model for such transactions assumes that, for a price, some amount of the capacity could be reserved for certain customers. The cost of such capacity reservations will be the unit demand charge times the capacity reserved plus the unit firm commodity charge times the amount actually used. This structure is consistent with the rate structure most widely used by the pipeline industry, although some systems do employ mileage-based rates. The cost for interruptible service is based entirely on the interruptible commodity charge. Interruptible service is available when space in the pipeline is not utilized by firm customers. The cost of interruptible transportation will generally be lower per unit shipped than the total cost for firm service, but higher than the firm commodity charge. Further, under most current-used rate designs, the variable cost of interruptible transportation will be greater than or equal to the variable cost of firm transportation. (Under the straight fixed variable rate design, the variable cost of firm transportation, excluding fuel, is quite low.)
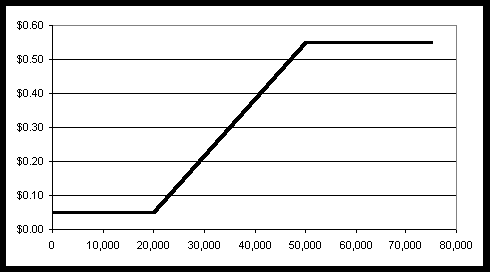
However, the value of transportation is not the same under all conditions. In slack periods, interruptible rates may be discounted significantly, as the non-fuel variable costs of transmission are quite low. Further, firm capacity can now be assigned in the capacity release market at less than maximum rates. GPCM™ deals with this problem through a discounting algorithm. Specification of the function requires the user to designate two points for each transportation zone: the FDQ and the ZDQ. Simply stated, the ZDQ is the flow volume above which the pipeline will not discount and below which it will begin to do so. The FDQ is the quantity at which the pipeline will offer its maximum allowable discount. The general outline of the relationship of these two points is shown below.
DISCOUNTING FUNCTION
FIGURE 2

The function works as follows. If demand for the capacity is higher than the ZDQ, the pipeline will be able to charge the full interruptible rate for transportation and will not discount. If not then it will discount. The amount of the discount in this model is maximal when demand falls to FDQ or lower. Then the price of transportation is equal to the firm commodity charge. The discount declines linearly as demand increases from the FDQ up to the ZDQ. For all demand greater than or equal to ZDQ, the price is the full interruptible commodity charge. No discounting occurs.
Platts estimated ZDQ to be at least 80% of “capacity”, although the capacity used was determined on a case-by-case basis. For multiple zone pipelines, Platts generally used the transport link capacity. For single zone system, coincident peak day volume was generally used. Platts generally estimated FDQ based on the amount of capacity reserved by firm customers. For Platts’ purposes, these points worked reasonably well. However, some users have debated whether these are the most relevant points to use. The system, fortunately, allows users to change the points easily.
Storage transactions work the same way. There are three storage transactions: injection, storage, and withdrawal. Injection and withdrawal have the structure just defined. Storage has a simpler structure: a constant unit cost per period, which may be zero. Firm storage also draws the appropriate demand charge. The user may model a situation where gas is transported to a storage location on one rate schedule, injected and withdrawn under another, and delivered to another location under a third. The user may also model a “bundled” structure involving movement from one location to the storage location and then downstream to yet a third, all under the same rate structure.
Marketers are modeled as a single undifferentiated sector in GPCM. The user specifies the minimum margin the marketing sector must earn on a transaction. This sector is assumed to mediate all transactions in the model. It is the sector which makes the market by linking gas supply to gas demand through the pipeline and storage system. This solution works because it mirrors the arbitrage function marketers perform in real markets.
Due to the impact of rate ceilings, short-term economic rents will not be acquired by the pipeline sector and are thus earned elsewhere. The bulk of the economic rent due to capacity restrictions is generally distributed to the “owner” of the capacity: the holder of firm transportation rights, or to the marketing sector to the extent that capacity has not been reserved. Suppliers and customers owning firm transportation earn rents by reselling their capacity to others or by using the capacity for their own account. Marketers earn rents because they are able to buy at market conditions, sell at market conditions, and acquire transportation at prices fixed in the short term. In working with the system, Platts found that one measure of its success in developing supply and demand curves was to examine the marketer margin. When this figure was higher than the low unit levels currently being earned, adjustments were in order.
User Interface and Database
The user interface is the principal analysis tool contained in the GPCM system. It consists of a set of queries, macros, modules, forms, and reports contained in a Microsoft Access97 file. The user interacts with this interface through Access “Forms”. Forms contain data from the database and controls such as button for causing actions to be done. The data displayed in forms is stored in database tables in a separate Access file. These tables are “attached” to the user interface so that they can be viewed and modified by the analyst.
The database file consists of a number of data tables for input and output. The data inputs are primarily of three types: tables representing the basic entities of the model (suppliers, supply regions, customers, demand regions, pipeline zones, storage facilities), tables relating these entities representing the structural linkages in the model (the arcs), and the quantitative data representing supplies, demands, tariffs, capacities, fuel use, etc. The GPCM user typically populates the database via Windows clipboard copy-paste operations from Excel or other spreadsheets. Alternatively, the user can utilize GPCM’s built-in data import routines.
Platts found that, although Access is certainly not the fastest in terms of input/output database performance, use of Access allows the user to work with exogenous analyses in Excel, and to import and export data with ease. Platts has used other economic modeling systems which run smoothly but are difficult to maintain and which do not work well with spreadsheets. Working seamlessly with Excel substitutes relatively cheap computing time for relatively expensive personnel time, greatly enhancing the usability of the system. Combined with the speed of the optimizer, the system is eminently usable.
RBAC Network Optimizer
RBAC Network Optimizer is a specialized LP algorithm designed specifically to solve network models such as that used in GPCM. In benchmarking tests on a large variety of such problems, it has proven to be world class in speed and functionality. RBAC Network Optimizer has been extended to handle the linearized approximations of non-linear supply, demand, and transportation cost functions required for the solution of the GPCM model.
Output
GPCM contains powerful and flexible tabular and graphical output capabilities. In addition the entire solution can be exported to an Excel spreadsheet for further analysis and reporting.
Following is a list of some of the pre-packaged screen and hard copy reports available in GPCM:
- Case Summary Report
- Income by Pipeline
- Income by Storage Company
- Income and Expense by Supplier (Producer)
- Income and Expense by Customer
- Production and Price by Supply Area
- Deliveries to Customers and Price by Area
- Pipeline Utilization by Company and Area
- Storage Utilization by Company and Area
- Basis Points Report
The latter report allows the user to find the basis (market price spread) between any two pipeline zones identified in the model in any period of the scenario. The report has a graphical capability which allows the user to produce a time series plot of the basis forecast over the forecast horizon of the case.
The Case Summary Report is an aggregate report of the gas and dollar flows among the various sectors of the gas industry. It shows the forecast aggregate average supply price, average unit return to the marketing sector, average transportation and storage cost per unit delivered, and average cost to customers represented in the model. There is also a graphical routine which allows the user to produce histograms comparing any of the elements of the case summary report for various cases.
Finally, GPCM has a general purpose graphing capability the analyst can use to plot time series of inputs and / or outputs, either one at a time or arrayed against each other. For example, the analyst could plot the time series of market clearing prices in two different regions in the same scenario or in multiple scenarios in order to get a visual perspective on their relative values.
RESULTS
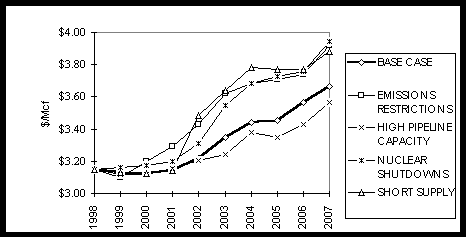
Platts used the GPCM system to complete the modeling portions of its study The Convergence of Gas & Power: Causes and Consequences, which was released in December. Due to rising demand, particularly from the electric industry, Platts projected higher real prices for natural gas in the next ten years. A summary of the forecast prices from the five scenarios developed appears below.
AVERAGE CITY GATE GAS PRICES, U.S., 1998 TO 2007, 1997 DOLLARS
FIGURE 3

In addition, the study shed light on changes in basis over the forecast period. Prices for Alberta supply rose relative to others, as new pipeline capacity reduced bottlenecks which have historically constrained flow out of the region. Basis between the Gulf Coast and New England also narrowed, as increased flow reduced the impact of discounting despite the addition of capacity in the Chicago to New York Corridor. Influx of new supplies produced the expected ripple effect across the country. When Sable Island gas reached the market, for example, prices in New England fell significantly. However, prices fell everywhere due to the displacement effects. Lastly, using the system, Platts was able to make well-reasoned predictions about the need for new pipeline capacity in the Alberta-to-Chicago and Chicago-to-New York corridors.
Had it not been for the development of a PC-based tool such as GPCM, Platts would not have been able to perform the detailed modeling necessary to reach these conclusions, the company’s extensive data resources notwithstanding. With the model, Platts’ study was successfully completed.
Dr. Robert E. Brooks is President of RBAC, Inc.. He holds a Ph.D. in Management with a specialization in Operations Research from MIT. His doctoral dissertation Allocation of Natural Gas in Times of Shortage: A Mathematical Programming Model of the Production, Transmission and Demand for Natural Gas under Federal Power Commission Regulation was completed in September 1975. Since that time, Dr. Brooks has authored papers about and designed models of natural gas pipeline networks.
Robert Ineson was Principal of Natural Gas Consulting at Platts and as such led Platts’ study The Convergence of Gas & Power: Causes and Consequences. He has 25 years energy industry experience and is now with Cambridge Energy Reseach Associates. He holds an MBA from the Wharton School of Business Administration.


