Virginia is home to many things – the nation’s capital, some of the worst traffic in the country, and 7.6 GW of data center IT load, according to Mordor Intelligence, or about 600 facilities. That’s more computing capacity than anywhere else in the country (or even the world), and that’s only expected to increase in the next 25 years. So, how much energy – and specifically natural gas – will these data centers need? And how will it impact markets around Virginia and the rest of the country?
To answer these questions, we used RBAC’s GPCM® Market Simulator for North American Gas & LNG™ to forecast natural gas demand in Virginia over the next 25 years, using projections provided in a recent state report. The report provides forecasts for electricity generation by source (e.g., combined cycle gas turbines, gas peaker plants, etc.) needed to meet Virginia’s electricity needs assuming one of three different scenarios – “unrestrained” data center growth in the state, moderate data center growth, and no additional data center growth. Using these electricity generation estimates, we converted the forecasts into natural gas equivalent units, developed three different demand scenarios – when data center growth in the region is high, medium, and static – and ran the scenarios based on the differences in gas-fired electric demand to see what would happen.
The Three Cases
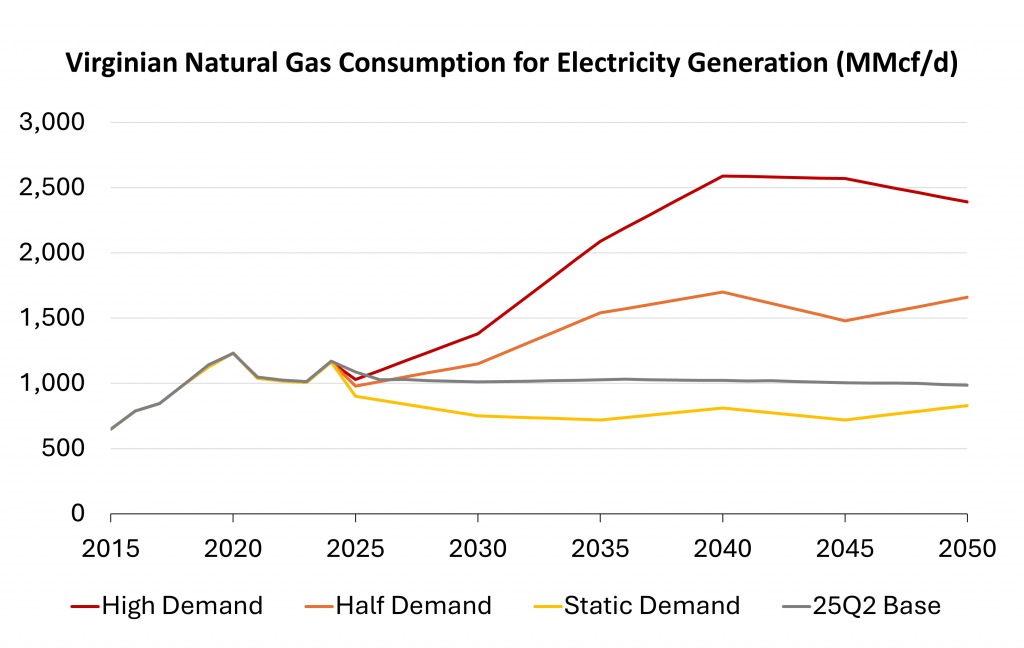
Comparing the three scenarios in Figure 1 below, only the static demand scenario translated into lower Virginia gas consumption over time. In the High Demand Case (red line), we forecast an increase in natural gas consumption from 1.2 Bcf/d in 2024 to 2.4 bcf/d in 2050, peaking in 2040 at 2.6 Bcf/d. This scenario represented what would happen in an unconstrained demand environment – what electricity generation needs and demand would be if data centers are built in Virginia with no hinderance from transmission development, land use concerns, changes in regulation, etc. The increased demand roughly translates into adding one 1,500 MW combined cycle gas plant every two years in the state – a pace that hasn’t occurred since the early 2000s. The Half Demand Case is a moderated version of the High Demand Case; here we forecast consumption increases to 1.7 Bcf/d by 2050. As we would expect, the demand in this scenario is roughly half of the High Case and represents natural gas demand in Virginia, assuming somewhat constrained data center development. In contrast, the last scenario, the Static Demand Case, which assumes data center demand growth stops in 2025, demonstrates a slight decline in consumption by 2050 to 0.8 Bcf/d.
Gas Flows
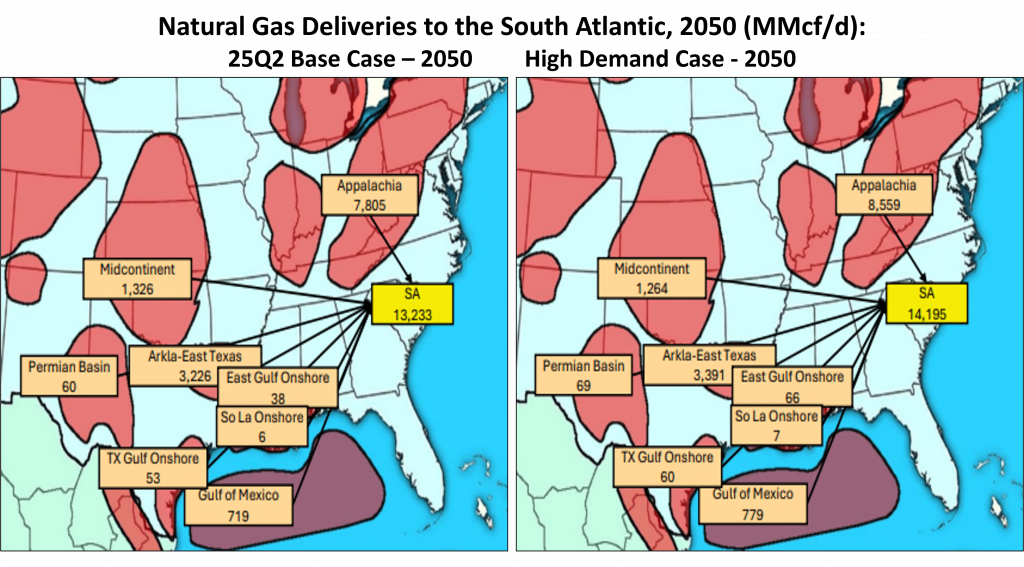
The Appalachia region, with the Marcellus and Utica shale plays, is the primary supplier of gas to the South Atlantic Census region (including Virginia) throughout the forecasted period (see Figure 2 below). However, the increased demand for gas seen in our High Demand case requires a significant increase in takeaway capacity from Appalachia – by the end of the forecast period, approximately 8.6 Bcf/d of gas is flowing to the South Atlantic in High Demand case, nearly a whole Bcf/d more than the 7.8 Bcf/d in our 25Q2 Base case. In addition, a small amount of gas also flows north from the Haynesville area by that time as well (3.4 v. 3.2 Bcf/d between the High and Base cases).
Looking more closely at the Appalachian Basin (Figure 3 below), and the other regions supplied by the basin, most of the increase in gas deliveries to the South Atlantic comes from increased production rather than decreased deliveries to the surrounding regions, at least in the aggregate. As an example, there are slight decreases in Appalachian deliveries to some neighboring regions (e.g., East South Central and the New England area), but these represent a fraction of the 0.8 Bcf/d increase to the South Atlantic. Instead, while our 25Q2 Base forecasts Appalachian basin production at 37.8 Bcf/d by 2050, the High Demand case forecasts production reaching 39.0 Bcf/d at that same time, more than accounting for the increase in demand in the South Atlantic.

The idea of Marcellus as the key supplier for increasing data center demand in Virginia and elsewhere has been echoed by several key producers. For example, in their recent earnings presentations, both EQT and Range Resources – large producers in the Appalachian region – indicated they plan to take advantage of opportunities in the near future due to increasing data center electricity demand.
Pipeline Constraints?
Given the increased production, the next question is how this gas will get to its primary destination in the South Atlantic. In GPCM, we can use the Supply Destination Report to show which pipelines, and when, will carry that increased gas production to the South Atlantic. This raises an important question: if pipeline capacity is insufficient, how will the forecasted increased supply meet the increased demand? Well, GPCM incorporates the use of an Auto Expand Feature, which automatically increases gas takeaway capacity if certain economic thresholds are achieved.
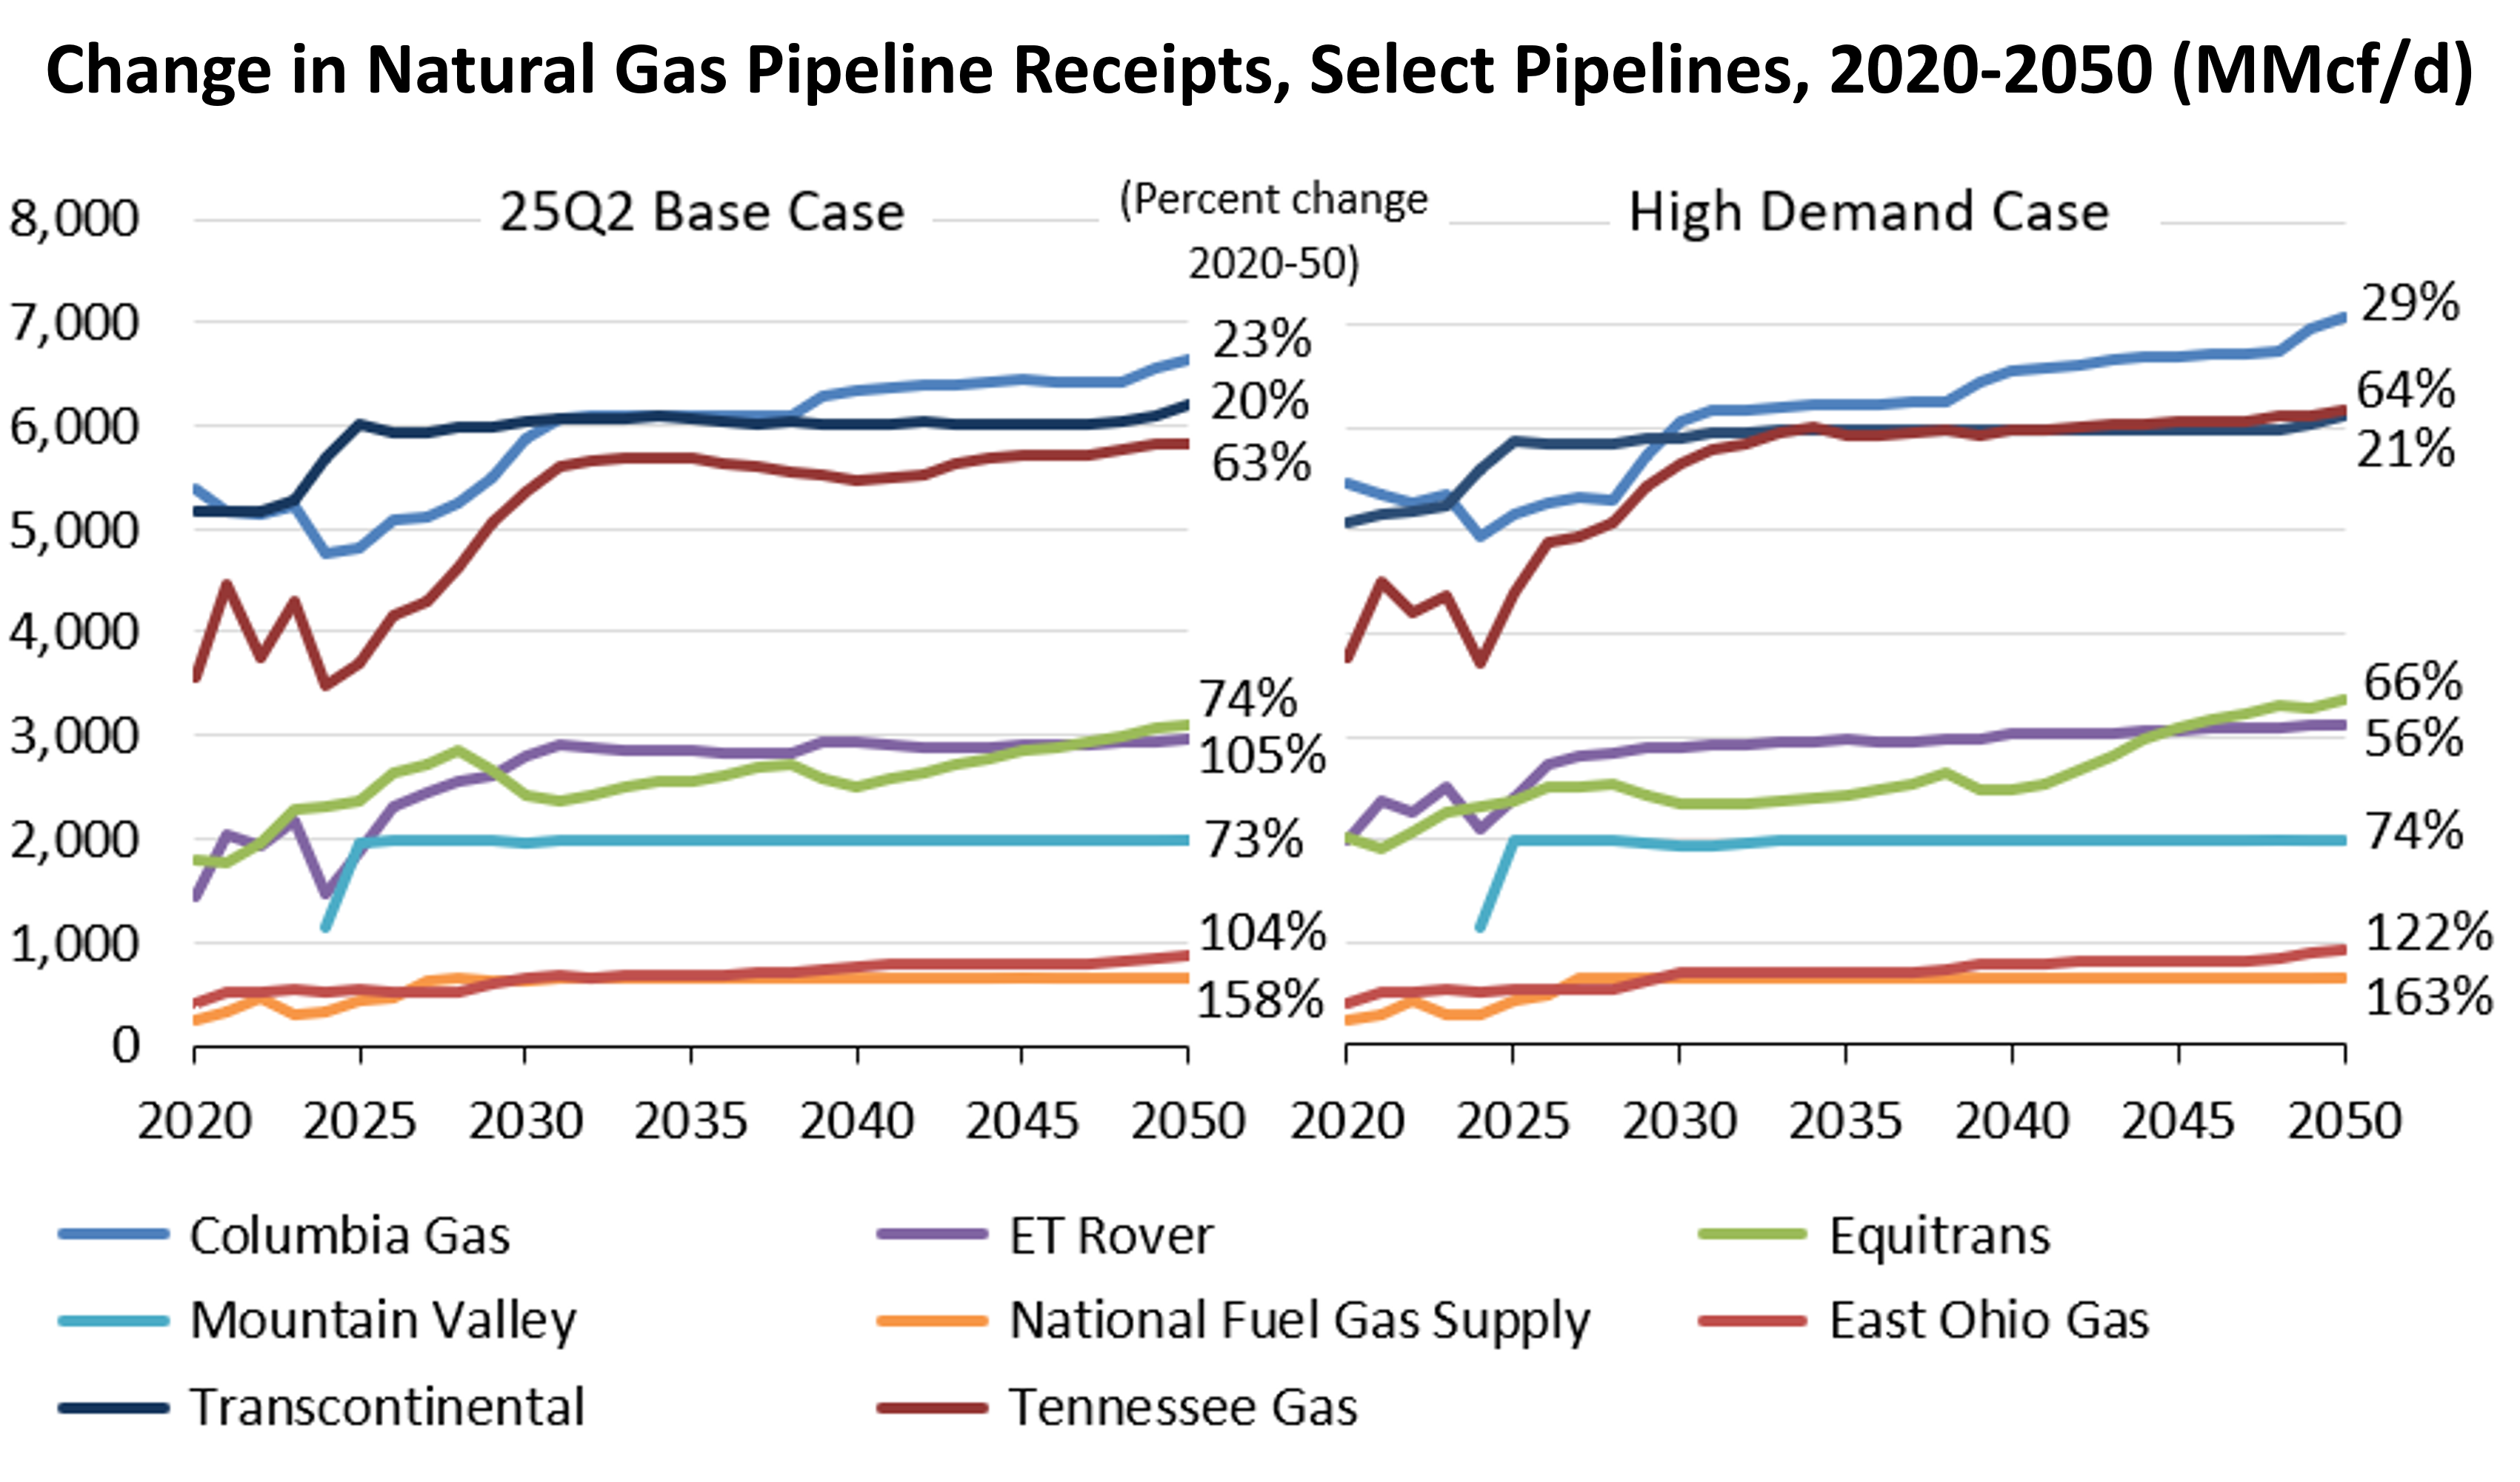
Comparing the 25Q2 Base Case and the High Demand Case (Figure 4 below), both cases forecast that the Tennessee Pipeline will experience the greatest increase in pipeline receipts from the Appalachian Basin (up about 2.3 Bcf/d in each case). However, in the High Demand Case, Columbia Gas sees the largest change in capacity volume growth, increasing 1.6 Bcf/d from 2020 to 2050 (29%) compared to the 1.3 Bcf/d (24%) increase in the Base Case Scenario, or a 5% difference. Given Columbia Gas’s current footprint, which provides pipelines from the Appalachian Basin to Virginia, and the role of that basin in supplying natural gas to meet growing demand, it’s no surprise that the pipeline saw such an increase. The National Fuel Gas Supply pipeline experiences the largest percentage growth in both scenarios, increasing by 163% in the High Demand Case (0.4 Bcf/d) compared to 158% in the 25Q2 Base case Scenario.
Natural Gas Spot Prices
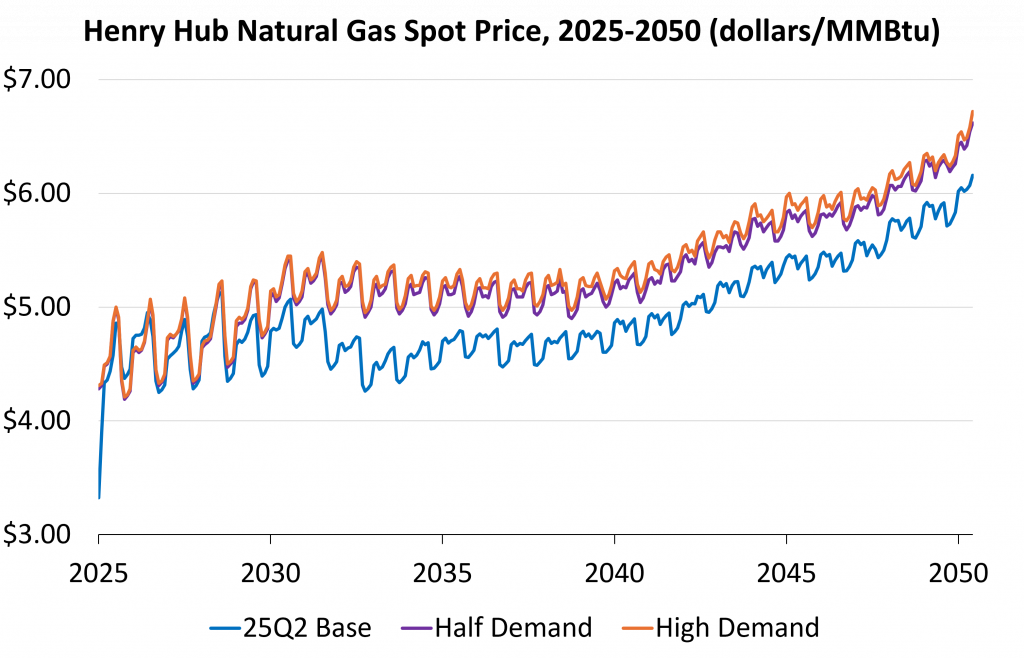
Following supply and demand, prices for natural gas rose significantly in both Virginia and nationally. For example, there is an approximately $0.55 difference in prices between our 25Q2 Base and the High Demand case throughout the forecasted period (see Figure 5 below). Additionally, although representing half of the demand increase from the High Demand scenario, prices in the Half Demand scenario are consistently $0.20 below the High Demand Case Henry Hub price.
Price increases driven by changes in demand are even more evident in price hubs closer to the Virginia region, such as Transco Zone 5 which is a good proxy for the Virginia area (see Figure 6 below). At this pricing hub, the increased demand from our High Demand scenario raises gas prices to ~$0.60 above the 25Q2 Base case scenario ($6.92 v. $6.30 in 2050 Q4). Similarly, prices in the Half Demand scenario ride mostly about $0.25 below the High Demand Case. Interestingly, the High Demand and Half Demand scenarios exhibit changes in their seasonality, showing a double peak in the summer and winter and then decreasing in the spring, which is not present in the 25Q2 Base case. This likely represents the reaction of prices to increased demand for cooling/AC during the summer, in addition to the traditional price increases seen in the winter heating season. Most demand from data centers is due to space cooling needs to keep the energy intensive CPUs and GPUs operating 24/7 (including during some hot, humid Virginian summers!).
The Final Word
Data center demand in Virginia is continuing to evolve and attract attention and potentially change price dynamics. For example, Dominion Energy’s new rates would heavily impact data centers, by creating a new rate class for large load customers and potentially increasing prices for centers looking to use Dominion’s grid. What impact this may have on electricity generation – and natural gas fired power demand – remains unclear. Moreover, many sources are developing estimates for energy demand from data centers, driven by increased digitization, Artificial Intelligence, and just the need for more computing power generally. The power leveraged in GPCM is that it allowed us to change one thing – natural gas fired electric generation demand in Virginia – and see the impacts on many different factors (production, flows, price, consumption); invaluable intelligence to make informed market decisions.
RBAC, Inc. has been the leading provider of market fundamental analysis tools used by the energy industry and related government agencies for over two decades. The GPCM® Market Simulator for North American Gas and LNG™ is the most widely used natural gas market modeling system in North America. RBAC’s G2M2® Market Simulator for Global Gas and LNG™ has been instrumental in understanding evolving global gas and LNG dynamics and is vital in fully understanding the interrelationship between the North American and global gas markets.