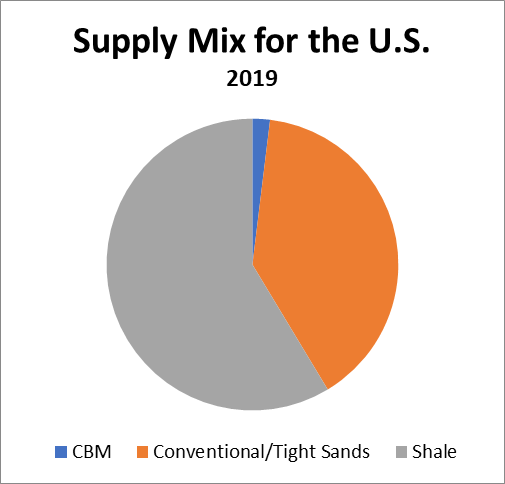
In 2005 two major hurricanes, Katrina and Rita, hit the Gulf with devastating consequences to residents and regional energy infrastructure. The resulting shut-ins, temporary and permanent damage to infrastructure and plants along with evacuations caused natural gas prices at Henry Hub, already much higher than today, to skyrocket to levels nearly double July 2005 prices. At that time, Shale production was still a glimmer in George P. Mitchell’s eye. In contrast, shale production comprises nearly 60% of all US production during 2020 to date. Meanwhile, current offshore gulf production only accounts for around 2.8 Bcf/d, or around 3%, of total US production versus 25% in 2004 pre-Katrina/Rita.
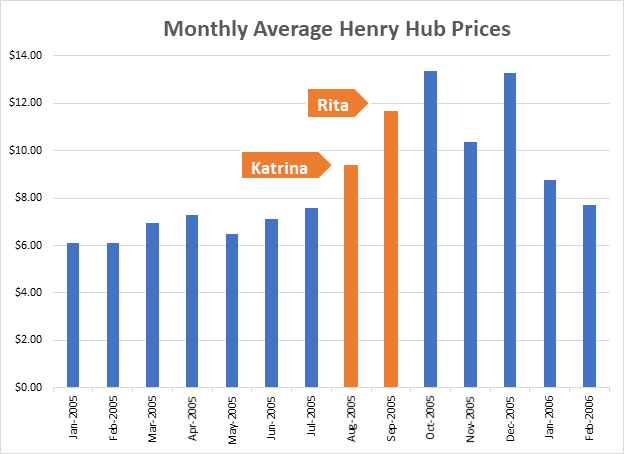
Fast forward 15 years and we may be witnessing a possible Fujiwhara Effect (where two hurricanes interact with the other) in Tropical Storms Laura and Marco that are both headed for the Gulf this week. The last time a Fujiwhara Effect occurred was in September 5, 1933, with Hurricanes 8 and 11 (this was before they named hurricanes). Laura and Marco are expected to reach hurricane strength, albeit not as strong as either Katrina or Rita, and therefore all gulf platforms and infrastructure are being shut-in. So, what could a double hurricane do to natural gas prices now that markets are more reliant upon onshore production?
To help assess the potential current and future market dynamics from a Katrina/Rita Hurricane scenario, RBAC has used its flagship product, the GPCM® Natural Gas Market Forecasting System™. The scenario assumes significant reductions over a 6-month period to offshore Gulf of Mexico (GOM) as well as southern Louisiana production. On the demand side, adjustments were made over 5 months for coastal industrial demand only as this was the sector that was primarily impacted by reductions in refinery, petrochemical, and other Gulf Coast industrial load. With the current Covid-19 environment, commercial demand is already impacted, and any reductions to gas-fired generation resulting from the hurricane are likely to be short-lived. The graph below shows the price impacts on Henry Hub. LNG export assumptions were not changed for the hurricane scenarios as they have already dipped due to Covid-19 and oil prices in the September 2020 time-frame and would not be impacted by a September hurricane in other months. As noted above, Laura/Marco storms are not predicted to be as strong as the Katrina/Rita event that is represented below.
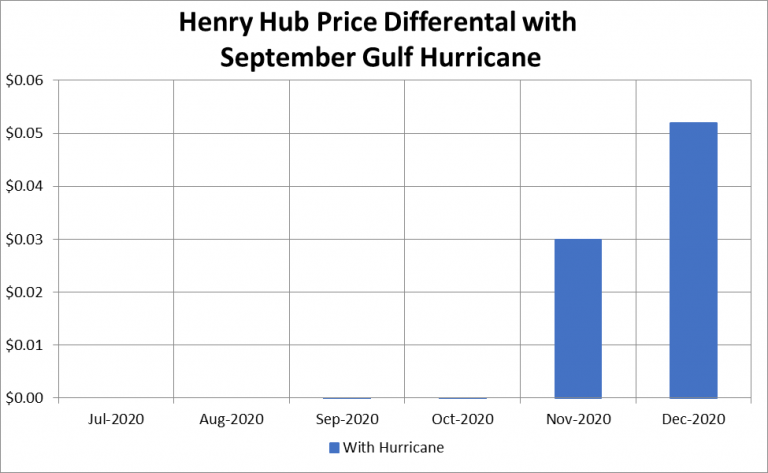
As shown in the above chart, the impact of a Katrina/Rita event in September 2020 on Henry Hub prices is essentially a wash until you get into the winter months and gas-on-gas competition for storage refilling/withdrawing starts to feel the delayed full production contribution to US totals from the gulf. The largest delta occurs in December 2020 with a gain of $0.05/MMBtu. It should be noted here that the hurricane scenario simulation utilizes RBAC’s 20Q2 outlook as the basis for scenario modifications and that the 20Q2 outlook represents the fundamental outlook as of its July 30th release date. Since that time, futures prices have rallied significantly, to approximately $2.40/MMBtu for the September 2020 contract and the winter months have rallied as well. Looking at the Commitment of Traders report (produced by the CFTC), clearly a shift from bearish to bullish positioning has helped drive this price rally but even under the current more bullish market sentiment, the above Hurricane price implications are maintained.
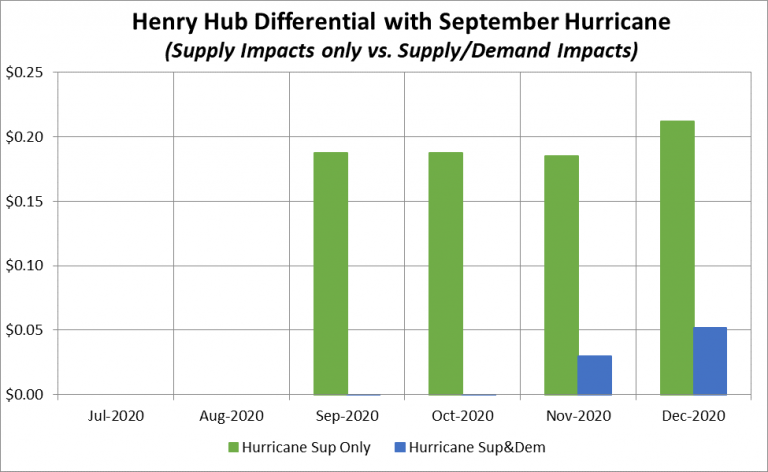
What is also interesting to note, is if industrial operations along the Gulf Coast are not nearly as impacted by the hurricanes as in our scenario outlined above, then the impact of losing supply due to gulf area shut-ins is more apparent. Here the largest delta also occurs in December 2020 with a gain of $0.21/MMBtu.
This idea of minimal impact to Henry Hub prices is reinforced by more recent events such as Hurricane Ike and Hurricane Harvey. Henry Hub prices during and after Hurricane Ike actually decreased. Hurricane Harvey saw fairly stable Henry Hub prices. These storms were not of the magnitude of a Katrina/Rita event but demonstrate the impact that shale gas has had on the total supply mix for the U.S.
These days many companies’ stock prices and enterprise value are being impacted by movements in Henry Hub prices – simply examine the number of bankruptcies occurring since the beginning of this year and then more recently, rebounds in valuations with natural gas prices now back over $2.00/MMBtu. No doubt, it is valuable to have a tool to help frame the risk from fundamental events such as hurricanes. GPCM is a useful tool not only for long-term analysis but also for ad-hoc short-term analysis. Here, GPCM reinforces the intuitive idea that the relative power of GOM production shut-ins do not have the punch that we experienced during pre-shale days. So, in effect, shale production has made U.S. energy production more “hurricane-proof”.
Lorem ipsum dolor sit amet, consectetur adipiscing elit. Ut elit tellus, luctus nec ullamcorper mattis, pulvinar dapibus leo.