Not quite a month ago, as midnight struck, the banging of pots and pans, shooting of fireworks and however else one might ring in the new year began. The annual celebration that occurs worldwide is often accompanied by the singing of Auld Lang Syne, or at least here in the states. What does the phrase ‘Auld Lang Syne” really mean? Britannica shows the translation to standard English is “Old Long Since” which can then be interpreted as “since long ago” or “for old times’ sake”.
Well, it may seem like long ago, but it was only 2 years ago that U.S. dry natural gas production set records at just over 97.0 Bcf/d – peaking in 4Q 2019. With RBAC’s 21Q4base release, it’s expected that in 2022 these records will be broken as dry gas production is estimated to reach approximately 98.5 Bcf/d before heading even higher as the decade progresses. Thus, it seems that old acquaintance shall not be forgot.
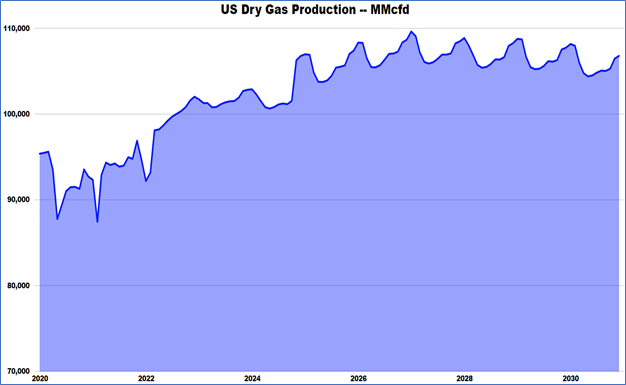
Source: GPCM 21Q4base, RBAC Visual Analytics
Things have certainly changed over the last 2 years, not the least of which has been the Covid pandemic and its impact on both supply and demand; but also, the greater financial discipline exhibited by U.S. oil and gas producers. A market that was previously characterized by “supply-push” dynamics has now arguably transformed to a “demand-pull” personality. Rebounding U.S. demand across all sectors has been impressive, and even with the continued growth and market penetration of renewable power generation; 2022 gas demand in the electric generation sector looks to be about 31 Bcf/d, exceeding the 2021 demand (just over 30 Bcf/d). Similarly, industrial demand is proving quite resilient and is set to exceed 22.2 Bcf/d for 2021, essentially equivalent to 2020 demand and about 1.0 Bcf/d below the highs of 2018 and 2019.
Should metrics like the Chemical Activity Barometer continue to show strong, positive growth, it would be expected that industrial production will remain strong as well (orange line in chart below is Industrial Production, the dark line is the Chemical Activity Barometer).
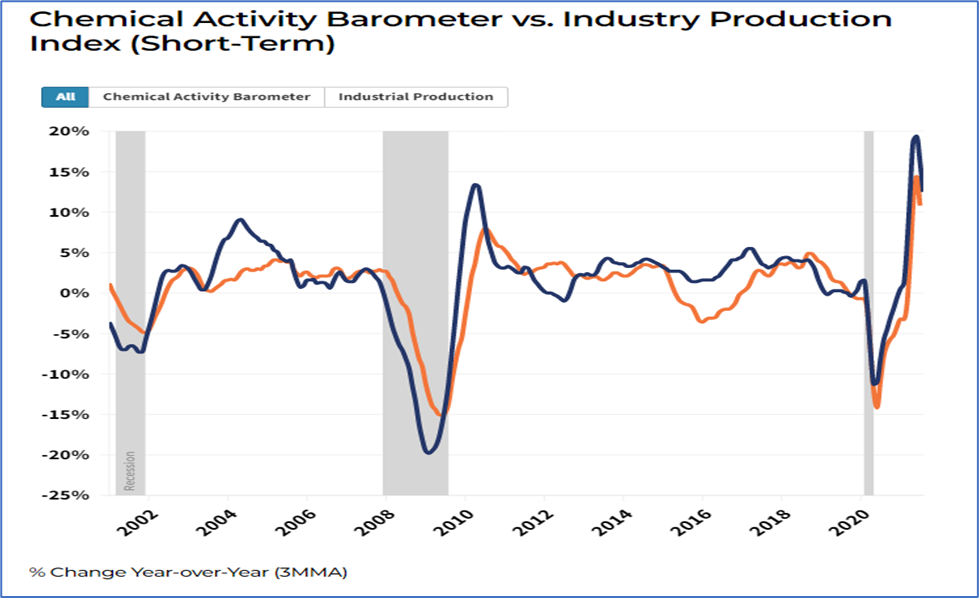
Source : https://www.americanchemistry.com/chemistry-in-america/data-industry-statistics/chemical-activity-barometer
It is not only the demand rebound in the U.S. that has impacted supply/demand balances and the demand-pull situation. Global demand has rebounded strongly as well, and this coupled with such issues as:
- Trading spats (China vs Australia, over Covid inquisitions)
- The penetration of renewable energy in the European Union (EU) and lower wind generation last summer
- Low LNG/natural gas inventories – Europe and Russia
- Nord Stream II sanction led delays and continued geo-political issues
have resulted in both TTF and JKM price spikes. Unsurprisingly, U.S. LNG exports have been running full out as the ARBs (arbitrage opportunities) have incentivized terminal operators to load every molecule they can onto LNG vessels. This environment has caused a resurgence in interest and final investment decisions (FIDs) discussions for LNG export terminal new builds and expansions. Even as the globe looks headed toward greener pastures, 2021 has demonstrated the need for natural gas as a bridge fuel and end-users cannot afford to be caught with their proverbial pants down, exposing themselves to price risk and volatility. One need only look at the number of companies that have gone bust in the EU and the burden placed on remaining companies as well as governments to ensure that, most importantly, their populations do not freeze, and secondarily, their industries don’t become unviable due to high energy costs.
The cumulative effect of these demand-pull factors will lead to U.S. production taking out previous record highs, this year. Obviously, what really drives the motivation for increased production is higher prices – especially as ESG and balance sheet/fiscal discipline has been the focus for the last year plus. NYMEX futures took some time to get motivated in 2021 but once they did, prices quickly ramped up. Starting 2021 in the mid $2.00s/MMBtu, natural gas prices remained range bound until summer when the range shifted to roughly between $3.00 – $4.00/MMBtu from May through mid-August. The $4.00/MMBtu top was then solidly breached, and prices quickly moved over $5.00/MMBtu. These prices and volatility levels haven’t been seen for years. Domestic weather, both forecast and actualized, clearly is a major factor impacting price movements, but the increased U.S. and global interconnectivity along with global weather, geo-politics, and prices, have added to the volatility – (blue line in graph below is natural gas prices, black line is the 50-day simple moving average, the columns are volume, and below that is the technical analysis MACD indicator).
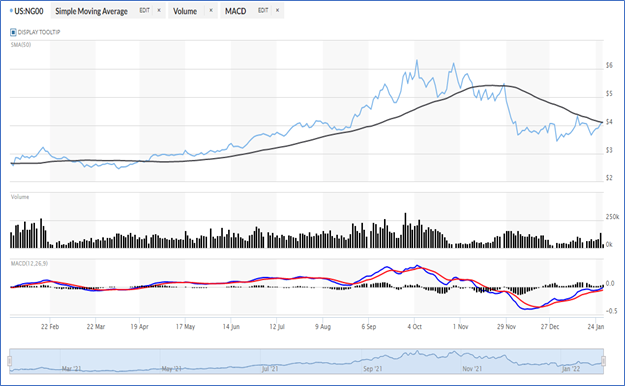
Source : https://www.marketwatch.com/investing/future/ng00/charts
The easier, low-cost route to increase production is to exploit the drilled-but-uncompleted well inventory, or DUCs, that have grown over the preceding years. This is exactly what has occurred since the middle of 2020. Predictably, the Permian Basin has seen the largest DUCs inventory reduction dropping by nearly 2,200 wells.
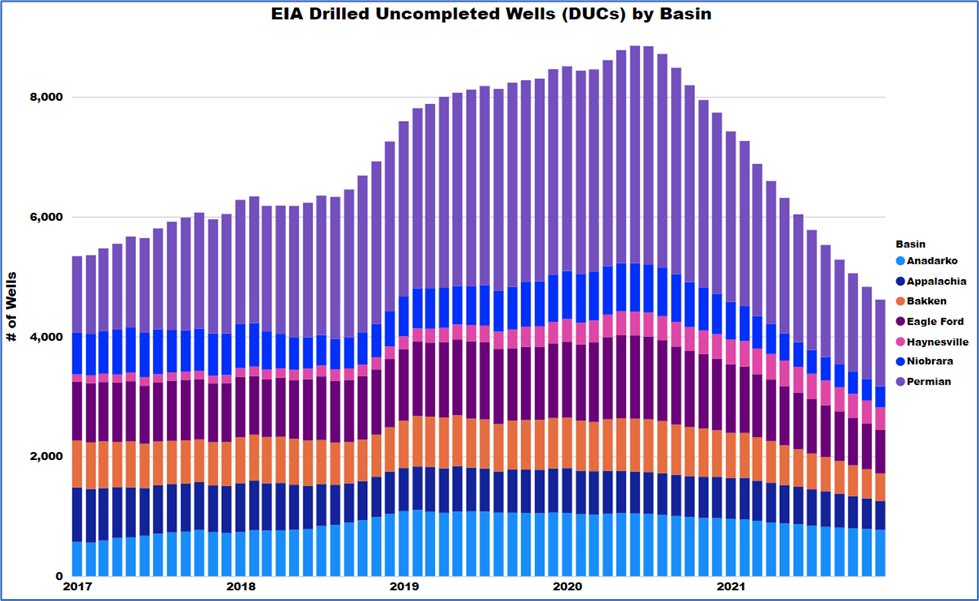
Source: https://www.eia.gov/petroleum/drilling/, RBAC Visual Analytics
Simultaneously, though, as prices have jumped higher for both natural gas (over $4.00/MMBtu) and crude oil ($85/Bbl) and with the forward curve / calendar strips for both also maintaining healthy levels, rig deployment has increased significantly. Having bottomed out in mid-2020 at around 240 rigs, Baker Hughes now reports over 600 oil and gas rigs deployed. This is still well below the peaks seen back in 2012 and 2014. It remains to be seen how efficiency improvements will impact rig demand. On the flip side, cost dynamics have also changed with inflation impacting labor, equipment and other drilling and completion aspects.
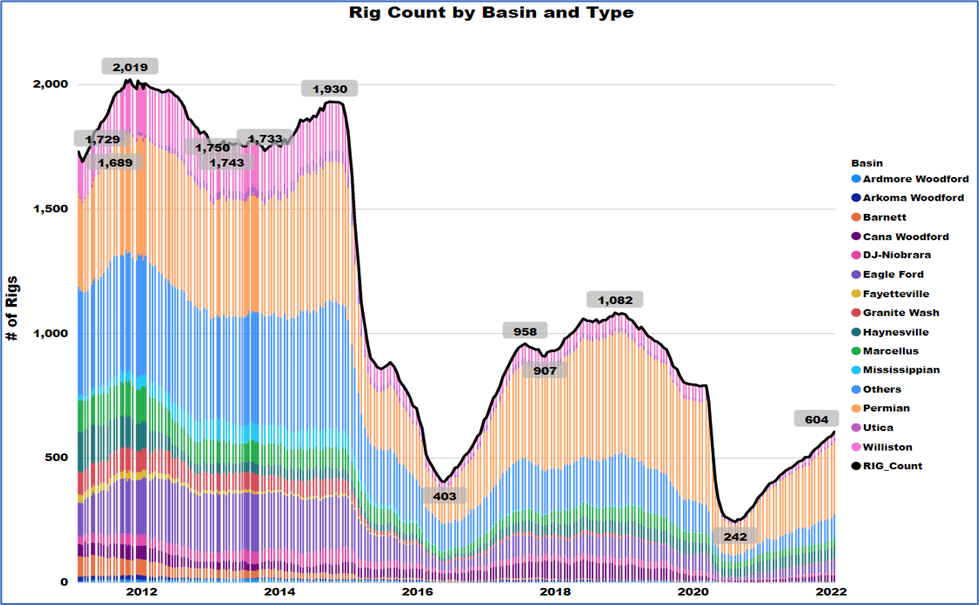
Source: https://rigcount.bakerhughes.com/na-rig-count, RBAC Visual Analytics
RBAC’s 21Q4 base case release projects continued U.S. production growth through 2027 before flattening out through 2035 and then slowly declining thereafter. A greater reliance upon Canadian production occurs from 2030 onward especially as more Canadian LNG export capacity comes online. As noted, the production growth is more a result of demand-pull characteristics that have materialized over the last few years. It has been pretty amazing to see how rapidly market dynamics can change. It was only a few years before that North America production, and specifically U.S. shale production (we’ll include here the Permian basin even though it’s really a tight sands, predominately oil play), was setting records on the back of aggressive drilling and extraction of the robust resource base. This supply-push mentality quickly evaporated, but it only goes to show that old acquaintances should not be forgotten and what seems long since, can sometimes be just a few years ago. So, here’s wishing all a prosperous and healthy 2022 and Auld Lang Syne!
© 2022 RBAC, Inc. All rights reserved. GPCM, GPCM Market Simulator for North American Gas and LNG, G2M2 and G2M2 Market Simulator for Global Gas and LNG are trademarks of RT7K, LLC and are used with its permission.