The natural gas market has been at a critical moment of change in recent years. This study first highlights the trends, uncertainties, and challenges faced by the global gas market from the LNG value chain to macroeconomics, then further address the question: what will this mean for the global gas market and LNG trade going forward? Scenario planning is used to identify different implications on LNG trade flows.
Macroeconomic Environment and Market Trends
Macroeconomic Environment:
Two major trends could highlight the uncertainties and challenges faced by the current global gas market.
- Geopolitical events that could overthrow the balance of regional markets and energy resilience return to the focus of many LNG buyers.
In the current winter month, the global market balances after months of high prices and aggressive built-in inventory for the European market. However, the balance is delicate: any weather event or other geopolitical motion could still pose a threat and create new volatility in the market. Policymakers in major markets are actively considering strategies to improve the resilience of their gas supplies. For example, Japan has announced an increase in LNG’s backup reserve with extra cargo purchases in the winter months. Therefore, the global natural gas market continues to be bullish with high volatility in the short term.
- The pressure of inflation and the threat of economic slowdown remains in the market, while policymakers are utilizing the opportunity to boost the economy to accelerate energy transition progress.
The latest IEA world energy outlook revised the natural gas demand downward, considering newly passed government policies in key economies, introducing more competition from renewables and emerging energy technologies like hydrogen against existing demand for natural gas.
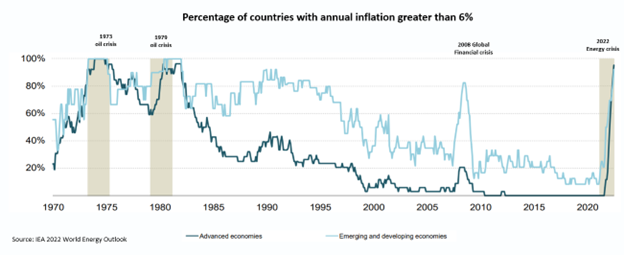
Figure 1 demonstrates the percentage of countries with annual inflation reported greater than 6% since 1970. For developing and developed countries, the percentage of countries reporting inflation since 2021 is approaching 100% by 2022, implying that inflation is a global phenomenon affecting most countries.
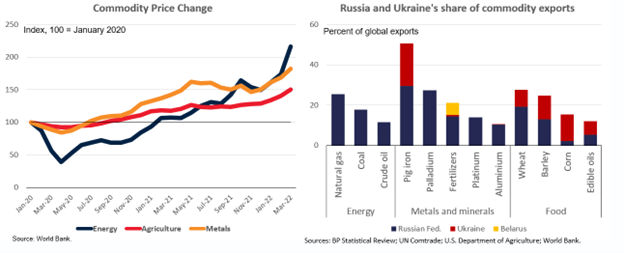
The key drivers for global inflation are fast-rising commodity prices in energy, agriculture, and metal, since 2020. The pandemic has put pressure on the global supply chain of these commodities. At the same time, the Russian invasion of Ukraine in 2022 only drove the prices to an even higher level due to a direct impact on exports from Russia and Ukraine for products in these commodity groups. The left side chart in Figure 2 shows the share of commodity exports by Russia and Ukraine for commodities in energy, metal/minerals, and agriculture products. Furthermore, due to the high degree of exposure of Russia and Ukraine’s exports on key commodities, despite efforts to fill the gaps by importing countries, it will take time to resolve the global supply chain constraints completely. Hence, this implies that inflation concerns remain for the global economy, as shown in the recent IMF forecasts.
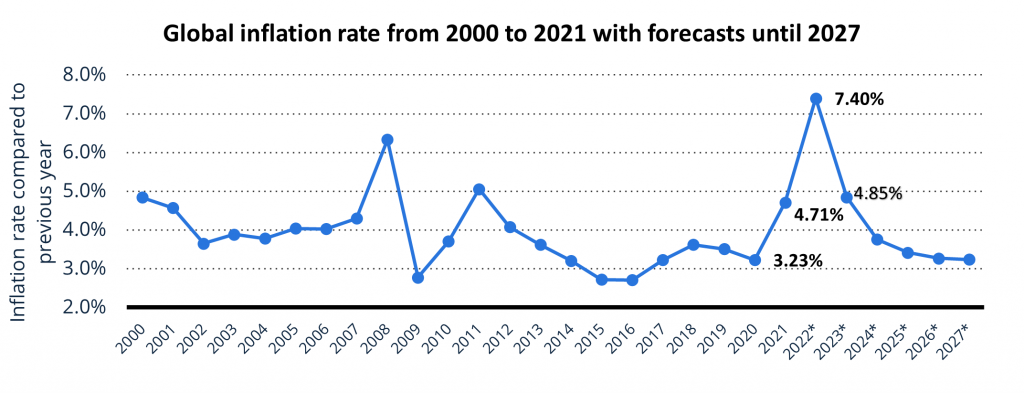
In Figure 3, despite the economic impact of the coronavirus pandemic, the global inflation rate fell to 3.23 percent in the pandemic’s first year before rising to 4.7 percent in 2021. This increase came as the impact of supply chain delays began to take more of an effect on consumer prices. After the Russia-Ukraine war, IMF estimated that global inflation in 2022 will reach 7.4 percent. This is the highest annual increase in inflation since 1996[1]. Furthermore, IMF estimates a high inflation rate through 2024, close to an average of 5% globally, before dipping to a lower level.
[1] Global inflation rate from 2000 to 2027 | Statista. https://www.statista.com/statistics/256598/global-inflation-rate-compared-to-previous-year/
Concerns about inflation and economic recession have put government actions and responses into the spotlight in 2022. First, energy investments hit a new record in 2022, with additional policy support and programs coming soon.
The IEA energy investment report showed that, across all sectors, technologies, and regions, that world energy investment is set to rise over 8% in 2022 to reach a total of USD 2.4 trillion, well above pre-Covid levels. Investment is increasing in all parts of the energy sector. However, the major boost in recent years came from the power sector – mainly in renewables and grids – and increased spending on end-use efficiency. Investment in oil, gas, coal, and low-carbon fuel supply is the only area that, in aggregate, remains below the levels seen before the pandemic in 2019. Despite sky-high fuel prices generating an unprecedented windfall for suppliers: net income for the world’s oil and gas producers is set to double in 2022 to an unprecedented USD 4 trillion[1].
In the year 2022, many governments have taken the opportunity to put a stronger focus on energy transition and passed new regulations and policies to accelerate energy investments, for example, the U.S. Inflation Reduction Act, European Commission REPowerEU program, India’s Energy Conservation Act, and Japan’s Green Transformation plan. These policies are critical in nudging the energy sector’s transition in future years.
These government policies created opportunities to introduce catalysts for market momentum in emerging sectors and created job opportunities to ease the threat of recessions. However, it is important to recognize the risks of these new policies in the current economic state.
First, inflation can offset investment returns and risk stagnation. According to the IEA report, about half of the incremental USD 200 billion of capital investment in 2022 is likely to be offset by higher costs rather than bringing additional energy supply capacity or savings.
Second, most policies passed in recent years have a clear focus on a specific set of energy technologies that remove competition among alternatives and potentially hinder innovation in competing solutions by picking winners and losers
Finally, despite the ambition and commitment, implementation challenges remain for these targets. For example, the U.S. IRA will require record-setting speed in adding infrastructures to support new investments for the next 5-7 years, which includes the assumption of adequate human capital support, regulatory processes, and manufacturing supply chain, which are clearly above the current status quo.
[1] Overview and key findings – World Energy Investment 2022 – Analysis – IEA. https://www.iea.org/reports/world-energy-investment-2022/overview-and-key-findings
Gas Market Trends:
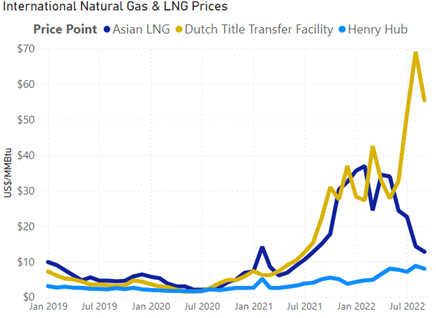
The global natural gas market has been in turmoil in the past year. Significant increases in inflation, shifts in sources of supply caused by the Russia-Ukraine conflict, and high energy prices have contributed to the tight market with increased volatility since early 2022. However, recent price drops in October and November in the European and Asian natural gas markets show signs that the market may be calming down.
While it is still too early to determine if these recent price trends can be sustained, especially heading into the winter heating season in Europe. For now, it seems that Europe has been able to mitigate the loss of Russian supply with an increase in LNG imports while also increasing its gas storage levels. Any severe weather events could tip the delicate balance in the global LNG market and require more gas than planned which may lead to a challenge of refilling storage back for winter 2023-2024.
European Market Dynamics:
As stated above, the supply constraints created by the Russia-Ukraine conflict and the subsequent reduction in pipeline exports from Russia to Europe have led to a much tighter market with historically high prices. However, Europe has offset most of the declines in pipeline imports from Russia with additional LNG imports. Figure 5 below shows volumes of LNG imports by importing country in the EU27 plus the U.K. from Jan-2016 through Oct-2022. As shown in Figure 5, the LNG imports in the last year have increased to all-time highs.
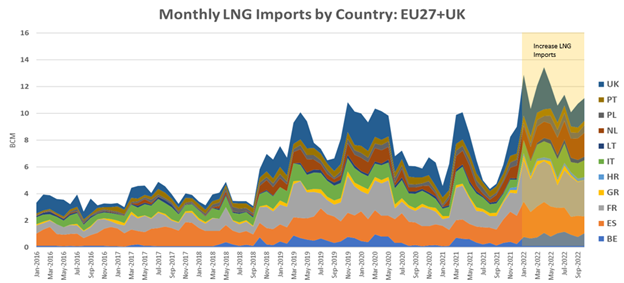
When comparing pipeline and LNG imports year-to-date (YTD) in 2022 (January through October) to the same period in 2021, the offset between additional LNG imports and declining Russia pipeline imports is even more apparent. As can be seen in Figure 6, in YTD 2022, Russia pipeline imports from Nord Stream are down 18.4 BCM, while Russian gas transited through Belarus and Ukraine is down 25.3 and 14.4 BCM, respectively, as compared to the same period in 2021. Offsetting these declines are additional natural gas imports, primarily LNG imports from Western Europe, and to a lesser degree, additional pipeline deliveries from Norway, Algeria, and Turkey (via the TANAP and Turkstream pipelines). In total, the YTD change in pipeline flows from 2021 to 2022 is negative 51.9 BCM, while the YTD change in LNG imports is a positive 48.8 BCM, nearly offsetting all declines in Russian pipeline imports.
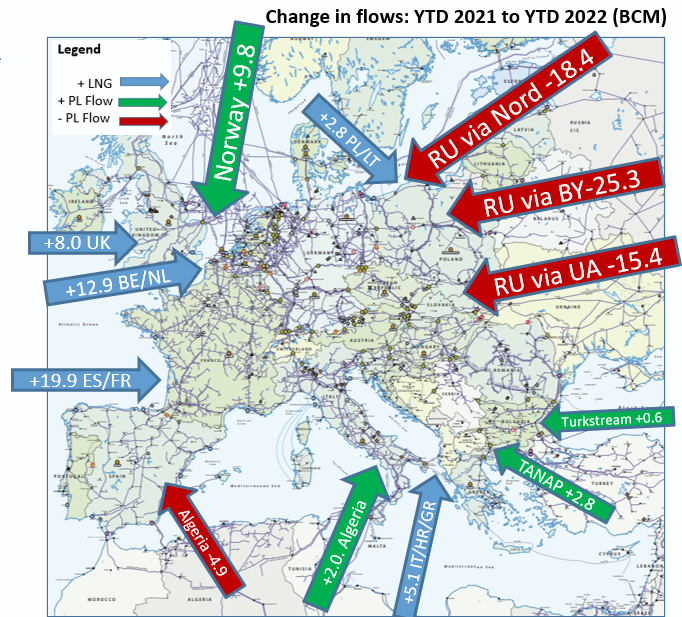
While the total volumes of imported gas (both LNG and Pipeline) remain relatively unchanged from 2021 to 2022, as seen in Figure 7 below, the sources of gas, and therefore the direction of flows, have shifted significantly. Thus far, E.U. Transmission System Operators have handled this flow shift. However, the significant change in gas sources has likely kept upward pressure on prices as contracted capacities on pipelines importing Russian gas have gone unused. In contrast, new contracted capacities for pipelines now flowing gas from LNG imports must be purchased. While the E.U. commission is working on strategies, including the E.U. Energy Platform, to increase cooperation among E.U. Members, plans are still in the early stages of development, and it is not yet determined what policies, if any, will be adopted or how they may help.[1]
[1]The EU Energy Platform is a voluntary coordination mechanism that plays a key role in pooling demand, coordinating infrastructure use, negotiating with international partners and preparing for joint gas and hydrogen purchases. https://energy.ec.europa.eu/topics/energy-security/eu-energy-platform_en

LNG Contracts and Terminal Capacities:
After a record year of LNG contracts, about 100 MMPTA in 2021 and almost 60 MMPTA signed in 2022, as shown in Figure 8. Unsurprisingly, Europe boosted its contracting activities in 2022 after Russia’s gas supply interruptions. Furthermore, it is interesting that despite those European countries trying to move away from natural gas to renewable sources of energy, most of the LNG contracts are signed with about 15 years of tenure, indicating a clear preference in LNG trading negotiation for long-term contracts.
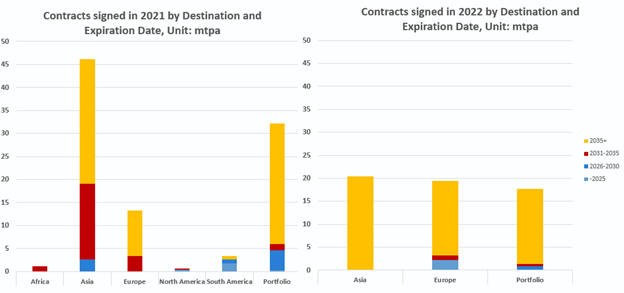
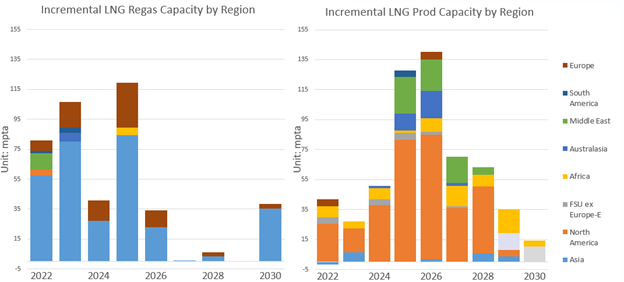
Figure 9 demonstrates the incremental LNG capacities of regasification (on the left) and liquefaction (on the right) by Region based on project announcements and updates. On the regasification side, approvals and construction of gas terminals in Europe speed up after the war starts. Europe will add 79 mmpta regasification capacity from 2022 to 2026, an increase of 56% from its regasification capacity in 2021. It is important to recognize that although there is much focus on European’s LNG import need, 272 mmtpa additional regasification capacities will be added in Asia, mainly for China, India, and the Philippines from 2022 to 2026, growing stably till 2030.
On the LNG production side, North America (mainly the U.S.) is contributing 55% (236 mmpta) of the total incremental capacity, followed by Qatar (41 mmpta), Canada (36 mmpta), and Australia (27 mmpta) from 2022 to 2026.
Scenario Planning Approach
This study aims to address the question: what will this mean for the global gas market and LNG trade going forward?
Scenario planning is used to identify different implications on LNG trade flows. IEA published the world energy outlook in late October, and this time’s publication presented three scenarios that describe the distinctive pathway of the future energy system.
RBAC global gas team has published a study that takes the global energy system scenario through the global gas market simulator G2M2® and provides more robust and detailed insights into the gas market and LNG flow in long-term scenarios. G2M2® provides the analyst to customize short- to long-term scenarios based on various assumptions, including demand, supply, and infrastructure. In this case, two alternative long-term market scenarios are created based on the published demand for natural gas from the IEA scenario.
The IEA gas projections are taken as inputs into the G2M2®, which reflects the fundamental long-term projections of the gas demand movements. Furthermore, the G2M2® model simultaneously preserves the element of price elasticity for demand in its forecasts. In other words, the G2M2® model provides a feedback loop for the local price of natural gas given demand assumptions and then solves for the equilibrium demand quantities in each local market at a clearing price that balances local demand and supply. Given its granular setup of the gas value chain, these scenarios will also provide detailed insights on changes in global gas trade in pipeline and LNG, given these demand assumptions from IEA scenarios.
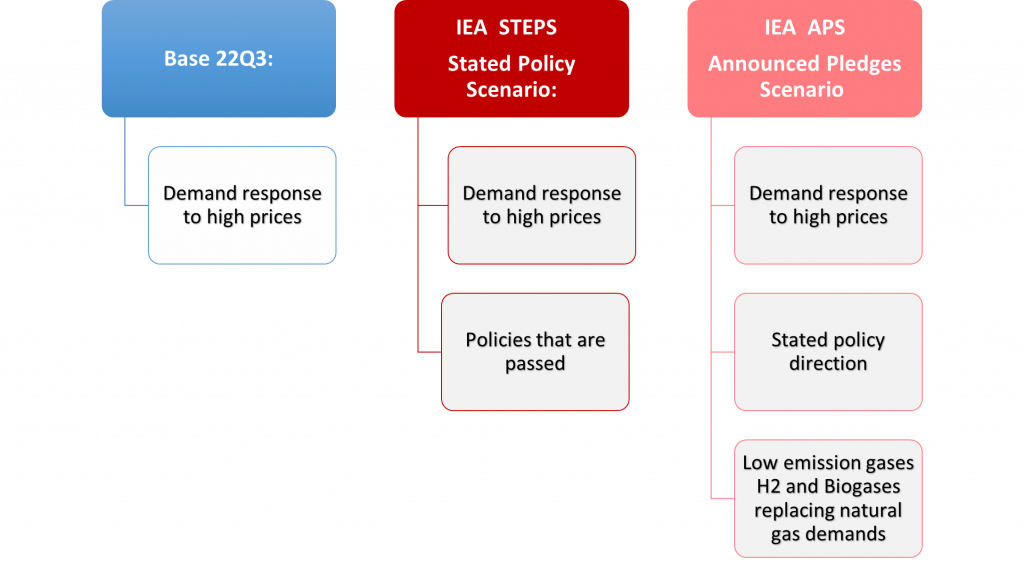
Three long-term scenarios estimate impacts on the gas market and LNG trades in an incremental fashion, demonstrating assumption comparisons in Figure 10.
IEA STEPS case – this is the first IEA scenario that utilizes the “STEPS” scenario’s demand assumption, including all passed major policies in 2022 that would influence the gas demand in the future. Note that the STEPS case does assume that the government’s policies passed will be implemented effectively without considering the risks of implementation.
IEA APS case –IEA scenario utilizes the Announced Pledge Scenario (APS), including all the passed major policies and all countries’ announced pledges that may not yet have any specific policies support.
Base 22Q3 case – this is a base case scenario based on RBAC’s G2M2 22Q3 base case, which does not include any policy-driven assumptions on demand for major markets, and only impacts due to price elasticity of gas demand are considered. This base case compares any incremental government policy impact and is a benchmark in this study.
Scenario Results and Findings
This section highlights key insights from these scenarios.
Gas Consumption:
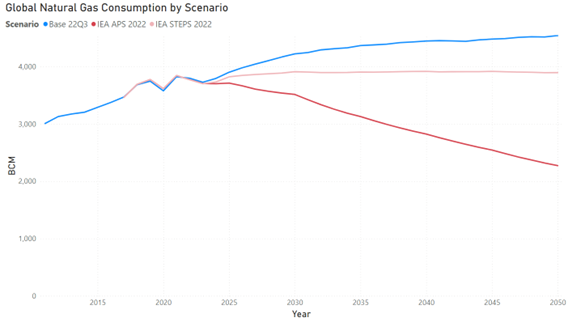
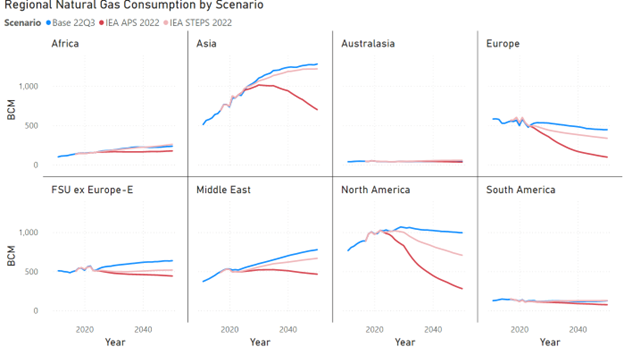
First, the global gas consumption by scenario demonstrated the aggregated impact of gas consumption based on the demand assumptions in Figure 11. Global consumption is estimated at 3824 BCM. The Base 22Q3 follows a gradual growth picture of natural gas for the long-term reaching 4520 BCM in 2050. IEA STEPS scenario presents a much flat projection with less than 3900 BCM in 2050 and there is a fast- declining demand shrinking by 40% of volume with the equivalence of almost 1570 BCM by 2050 in IEA APS scenario. Figure 12 takes a closer look at the regional gas consumption differences.
- The regions with the highest reduction potential in volumetric terms, compared to its current consumption level, are North America (-743 BCM in 2050 compared to 2022) and Europe (-438 BCM in 2050 compared to 2022). That implies that both regions have the most aggressive policy drivers that would reduce natural gas consumption. The differences in natural gas demand reduction can be observed in the next 3-5 years to confirm the exact pathway the market is heading.
- Asia has the highest growth potential in the future scenarios among all regions, with a projected demand increase of 430 BCM and 368 BCM in 22Q3 Base and IEA STEPS scenarios, compared to the estimated current demand of 850 BCM in 2022. That implies that the Asian gas demand is relatively inelastic with current policies’ impact, indicated in the IEA STEPS scenario compared to 22Q3 Base. The much more aggressive reduction of natural gas depends on Asia’s fast-growing biofuel and hydrogen sectors, which could replace all incremental natural gas demand in the APS scenario by 2050, with lower gas demand than its 2022 level.
The full G2M2 scenario includes the output of gas consumption and production by country or sub-country level (for Australia, China, and India, etc.), with sectorial projections among electric, industrial, transportation, residential and commercial. Overall, the gas demand for the electric generation sector presents the greatest differences between scenarios due to the focus on switching away from gas-fired generation to renewables by many government policy targets. In contrast, industrial demand for gas remains relatively inelastic for the STEPS scenario compared to the 22Q3 Base scenario.
LNG Imports and Exports Balance:
There is a need for additional LNG trade, regardless of the scenario. The main difference is that the level of gas trade over time and its incremental changes by origin. Figure 13 shows the regional natural gas liquefaction by scenario. It is no surprise to see North America leading the incremental LNG exports, with a relatively stable projection of growth by 2050 across all scenarios. In contrast, Africa and Australia seem to bear a major reduction of LNG production in the IEA APS scenario when gas demand is reduced in importing countries. It is also worth noting that the Middle East has strong growth potential in short to medium term for its LNG production, which aligns with Qatar’s recent active capacity expansion.
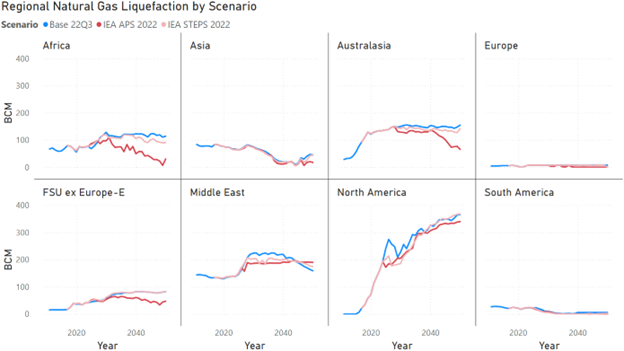
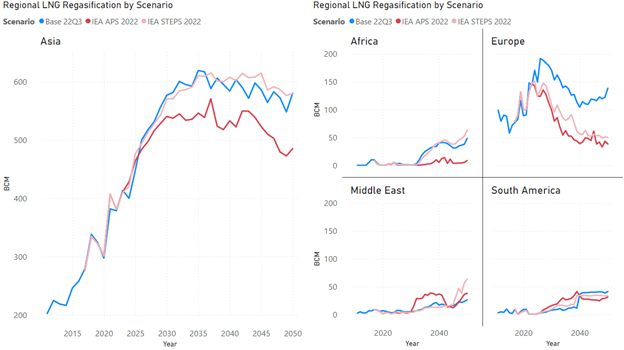
Figure 14 shows the regional LNG regasification by scenario. Asia is the major destination for LNG in the long term, while Europe has strong short to medium-term needs for LNG. Furthermore, mirroring the differences in natural gas consumption between scenarios discussed earlier, LNG imports to Asia are relatively stable for the Base Scenario and IEA STEPS Scenario, indicating the resilience of LNG demand in the Region with the current policies. While, European LNG demand has a much greater downside risk when comparing the IEA STEPS and APS scenarios with the Base Scenario, indicating the incentives for moving away from gas to alternatives by current European policymakers. That potentially could add additional risk in procuring reliable and cost-effective gas strategies for the short term, hence higher volatility of prices in upcoming winters for LNG buyers in Europe.
It is interesting to see additional LNG imports in the Middle East region, indicating additional imports for growing economies like Kuwait, UAE, and Jordan, among others. Although the volume in the Middle East region is dwarfed by Asian demand, it is expected to have long-term growth potential.
LNG Trade Flow:
G2M2® allows the user to dive into much more granular LNG flow forecasts in the outputs of the scenarios. With the observation of a reduction in LNG imports to Europe from IEA Scenarios (APS and STEPS) versus Base Scenario, Figure 15 shows the details of LNG imports into Europe by origin country, comparing the projected volume in IEA STEPS scenario compared to 22Q3 Base. The top chart shows the stacked column of total LNG imports by origin country in the IEA STEPS scenario, and the bottom chart shows the incremental changes of LNG imports by origin country in the IEA STEPS scenario compared to the Base Scenario.
Most of the incremental change in LNG imports is the reduction of North America LNG, which is represented by the 37.4 BCM reduction in the year 2030, while the difference gap narrows over time. That aligns with the fact that there is a wider gap in liquefaction level projected for North America between 2026 to 2030 in Figure 13.
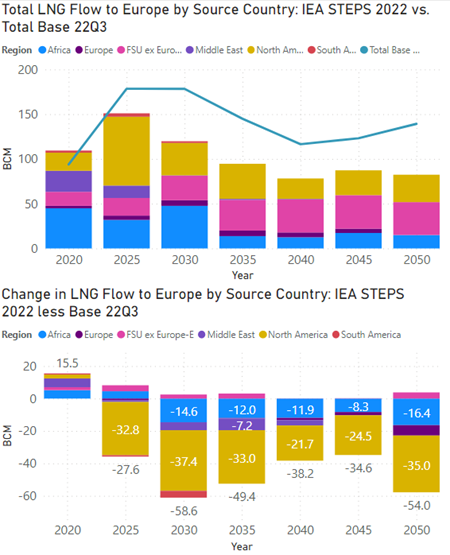
Figure 16 shows the LNG imports to Asia by origin countries in the IEA STEPS scenario compared to Base Scenario. Although there is little change in the volume of LNG imports to Asia between the two scenarios due to the shifts of LNG imports to Europe and other regions, there are still changes in LNG flow patterns to Asia. The bottom chart of Figure 16 shows the increase in Russia’s LNG from Europe to Asia.
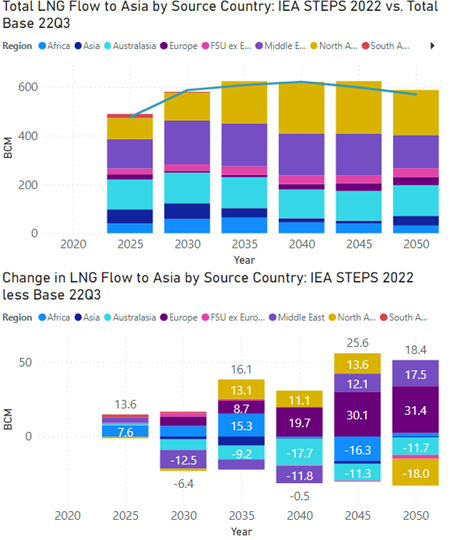
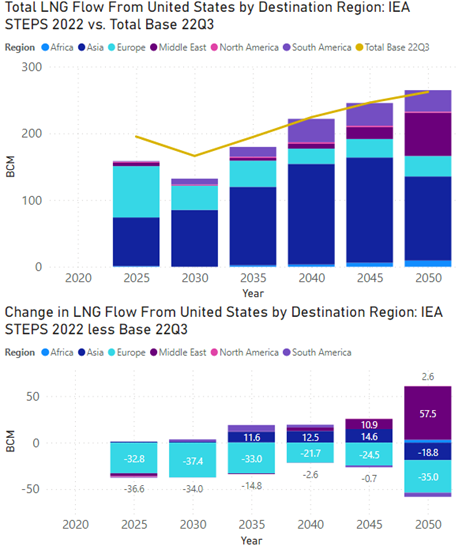
Figure 17 shows the LNG exports from the U.S. to destination regions in the IEA STEPS scenario compared to Base Scenario. It is also about the shifts in LNG trade flows of destinations much more than its aggregated impact on total volume for the U.S. The interesting dynamics of shifting away from Europe and back to Asia and emerging markets in the long term in the IEA STEPS scenario compared to the Base Scenario.
Regional Hub Prices:
Besides detailed LNG flow forecasts, this study also provides price forecasts for key regions.
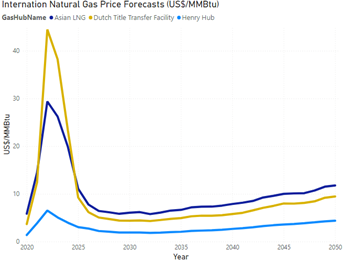
Given the trend of fast reduction in gas demand in Europe, the European gas price is expected to continue its temporary premium to Asian markets for the next two years and then come lower than the Asian LNG price by 2025, as shown in Figure 18.
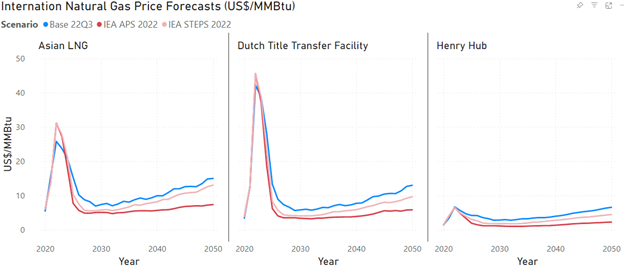
Figure 19 presents the international natural gas price forecasts through 2050 for Asia, Europe, and North America, by scenario. All three scenarios share the view that the market will return to a much lower price level than what was observed in 2022 based on fundamental drivers. However, there are remaining volatilities that may spike up the clearing prices. In the long term, there is still a trend of increasing prices in all markets to sustain production and continuous investments in the sector. The expected long-term price in Asia lands around 15 dollars/MMBTU in 2050 for Base Scenario and 13 dollars/MMBTU in 2050 for the IEA STEPS scenario. European market index of the Dutch Title Transfer Facility (TTF) price is estimated to land at 13 dollars/MMBTU for Base Scenario and 9.6 dollars/MMBTU for the IEA STEPS scenario in 2050.
Conclusion
The current market is at a delicate balance in the short term. Any severe weather events could tip the balance and use up more gas than planned, which is hard to refill back to the level for winter 2023-2024.
For the long-term outlook of natural gas, there is a wide range of possibilities for natural gas depending on the implementation of energy transition policies in key economies. Since many of the energy programs have a milestone target around the end of this decade, by the year 2030, it requires a swift movement in a tremendous amount of energy investments in the next five years for any possibilities to reach the target. Hence, there is a sense of urgency to move fast to renewables and hydrogen in many economies. However, it is critical to recognize that a successful energy transition requires synchronized changes in both the existing energy system and the new clean energy system. Incremental investments in high-value gas projects are still critical, especially those with integrated decarbonization solutions.

