
Global Gas and LNG Outlook for 26Q1
Overall, a tighter near-term market shaped by conflict and storage conditions, followed by a larger supply wave that changes the pricing environment before demand growth gradually catches up again.
Twenty percent. That number explains why global gas outlooks everywhere changed so quickly following the start of the hostilities involving Iran, Israel, and the United States on February 28, 2026. LNG trade through the Strait of Hormuz accounted for approximately 20% of global LNG supply in 2025. And that LNG trade has remained almost entirely disrupted since the conflict began virtually shutting down the strait.
But that is not the only reason a materially tighter near-term global gas market exists. European storage inventories were already at a 3-year low in February, driving demand for additional gas during the summer fill season. While near-term balances remain heavily influenced by geopolitical uncertainty, the longer-term picture is different.
With substantial expansion in global LNG supply beginning in the late 2020s, RBAC’s 26Q1 Base Case sees that supply growth contribute to a period of softer global gas pricing before long-term demand growth gradually tightens balances again in the late 2030s and 2040s.
In this article, we break down both supply and demand outlooks by region, see where gas flows are shifting, and examine the impacts of conflict and uncertainty around the world.
The Strait of Hormuz Disruption and 26Q1 Base Case Assumptions
The escalation of military conflict involving Iran, Israel, and the United States has had significant repercussions for global gas markets. Since its start in February, LNG flows through the Strait, representing the aforementioned 20% of global LNG trade, have remained almost entirely disrupted. Physical damage to infrastructure and precautionary production shut-ins across the region have impacted balances well outside the Middle East. And significant uncertainty exists regarding the evolution of the conflict, which remains intensely heated as diplomatic stalemates persist and regional tensions continue to threaten critical energy maritime corridors.
Thus, RBAC’s 26Q1 Base Case utilizes an “early restart” scenario as a consistent set of assumptions rather than a prediction of diplomatic outcomes:
- Qatari and UAE Production: Assumed to be shut down from March through May 2026. Based on official operational updates, production ramps higher in June 2026, with Das Island returning to full capacity in July and Qatargas reaching full operational capacity in August 2026.
- Qatargas Damage: Following the restart, Qatargas capacity remains approximately 13% below pre-conflict nameplate levels due to damage sustained during the March 2026 attacks. Full restoration of capacity is expected to take three years, with completion by May 2029.
- Qatari Expansion: The planned expansion of production capacity is delayed until July 2027. This more conservative timeline reflects current regional infrastructure uncertainty, contrasting with earlier announcements from project developers.
- Iranian Production: Given the damage from March 2026 strikes, production is assumed to decline by approximately 12% through April 2026. A gradual recovery follows in May, with production returning to pre-conflict levels by June 2026.
- Iranian Pipeline Exports: Due to infrastructure damage and supply disruptions, exports to Turkey and Armenia are assumed to decline by 50% in March 2026 and halt entirely in April 2026. These base-case assumptions do not extend the disruption beyond April.
- Israeli Production: The temporary shutdown of the Leviathan and Karish fields in March 2026 reduces total Israeli gas production by approximately 75% for that month. Production begins a gradual recovery in April and returns to pre-conflict levels by May 2026.
- Israeli Pipeline Exports: Export volumes are adjusted to mirror the production recovery profile, resulting in a 75% reduction in March 2026 and a 37.5% reduction in April 2026, before returning to full capacity in May 2026.
Regional Market Developments
Asia: Major Global Demand Drivers
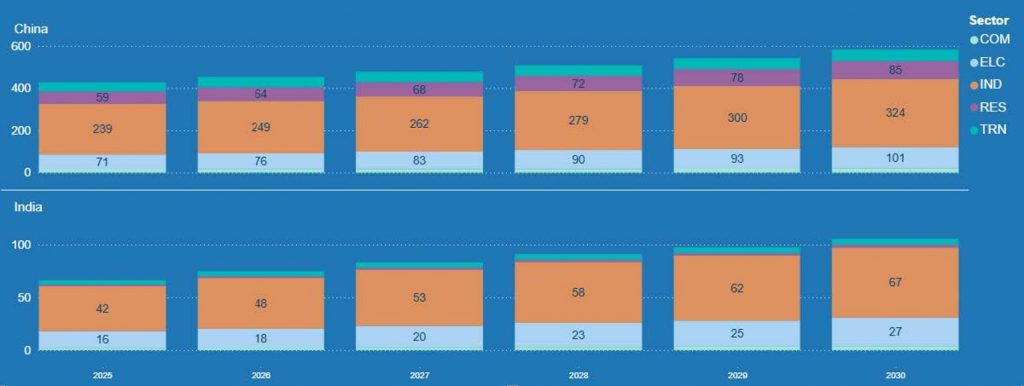
Asia continues to remain a major driver of global natural gas demand, led primarily by China and India. As shown in Figure 1, industrial consumption remains the largest component of incremental gas demand in both countries through 2030, supported by continued economic expansion, manufacturing activity, and rising energy needs.
In China, increasing power-sector consumption and residential demand also contribute meaningfully to overall market expansion as the country continues efforts to improve air quality and diversify its energy mix. India also shows broad-based increases across the industrial and power sectors, supported by urbanization, infrastructure investment, and rising electricity demand.
Looking ahead, Asian gas markets are expected to remain a key source of LNG import demand, reinforcing the region’s central role in global LNG market balances through 2030.
Europe: Infrastructure-Driven and Diversifying
The European natural gas market remains highly sensitive to changes in global LNG supply and storage conditions, with TTF prices continuing to reflect the region’s efforts to balance energy security, decarbonization goals, and shifting sources of supply.
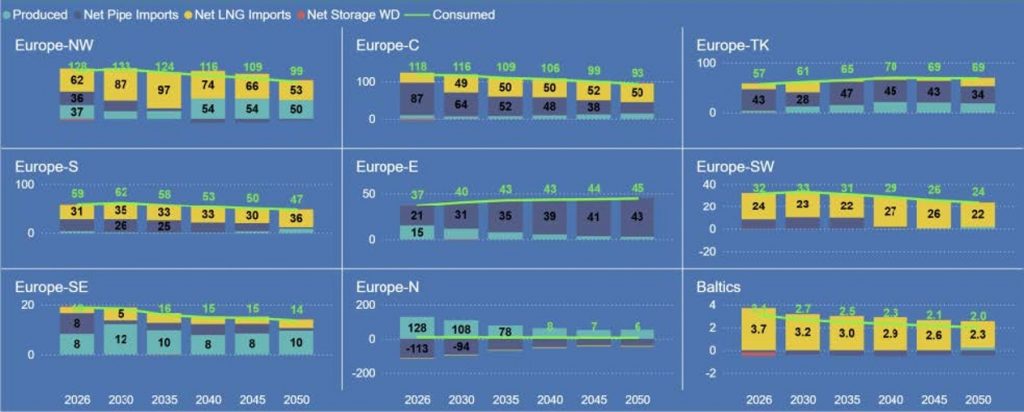
Figure 2 shows long-term European gas demand generally remains stable to gradually declining across most regions, with Northwest and Central Europe showing the largest reductions in consumption through 2050.
Despite declining demand in some mature markets, natural gas continues to play an important role in supporting industrial activity, power-sector reliability, and seasonal balancing needs as renewable generation capacity expands.
Regional gas balances across Europe also continue to evolve as LNG infrastructure expansions, interconnection investments, and changing pipeline supply patterns reshape trade flows within the region. Northwest Europe remains the largest LNG-importing region in Europe, while Central Europe continues to rely heavily on pipeline imports, though at gradually declining levels over time.
In contrast, Eastern Europe shows increasing pipeline import requirements later in the forecast period, while Northern Europe continues to act as a major producing region despite declining domestic production. Overall, the 26Q1 Base Case reflects a European gas market that becomes increasingly diversified and infrastructure-driven, while gradually reducing overall gas consumption and import dependence over the long term.
North America: More Production, More Liquefaction, and Rising Domestic Demand
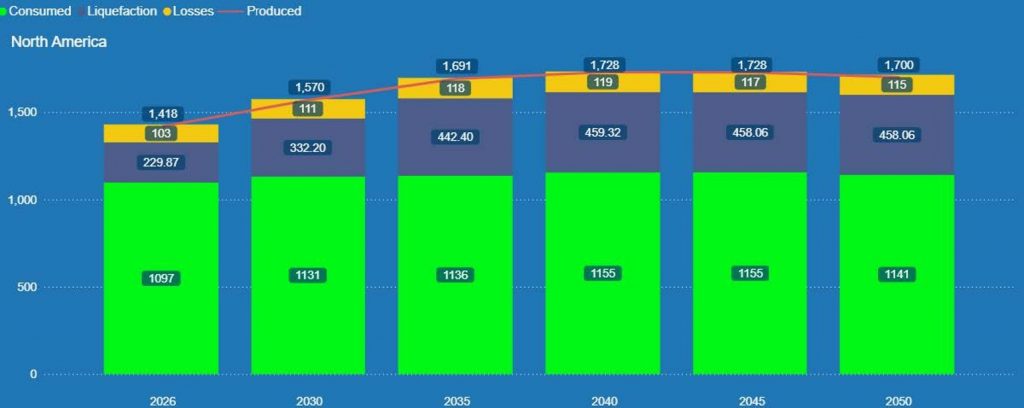
North America continues to strengthen its role as the primary source of global LNG supply in the 26Q1 Base Case, supported by robust upstream production and expanding liquefaction capacity. As shown in Figure 3, North American natural gas production increases from approximately 1,418 BCM in 2026 to nearly 1,730 BCM by 2040 before stabilizing in the later years of the forecast. This growth is largely driven by a significant expansion in liquefaction demand, which is projected to nearly double over the same period.
North American domestic gas consumption also continues to increase over the forecast period, led primarily by power-sector demand growth associated with rising electricity consumption and large electric loads such as data centers. Overall, the region continues to act as a key balancing supplier to global LNG markets due to its large resource base, flexible upstream sector, and expanding export infrastructure.
LNG Exports: U.S., Canada and Mexico
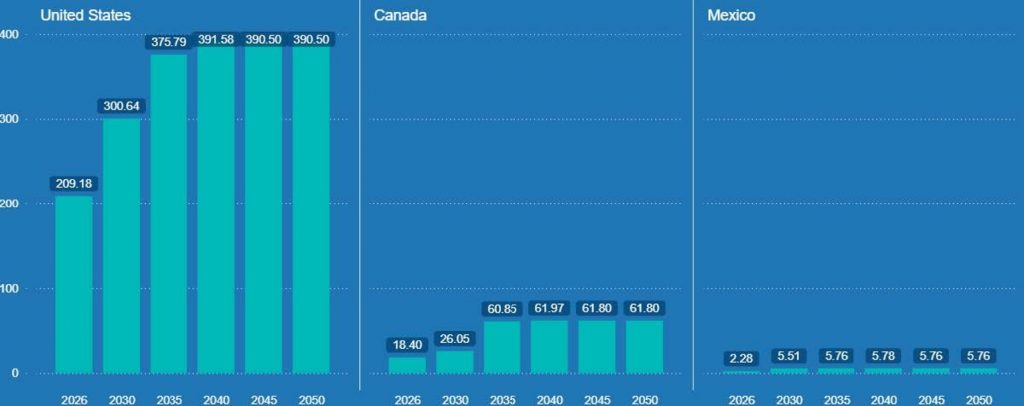
As North American liquefaction capacity grows, its LNG export volumes are projected to expand from 230 BCM in 2026 to nearly 460 BCM by 2040, with relatively stable export levels thereafter through 2050.
U.S. LNG exports continue to account for the majority of this growth, increasing from approximately 209 BCM in 2026 to nearly 392 BCM by 2040 before stabilizing in the later years of the forecast. Canadian LNG exports are also expected to increase materially over the forecast period as additional West Coast liquefaction capacity comes online, rising from approximately 18 BCM in 2026 to nearly 62 BCM by 2040. In contrast, Mexican LNG exports remain comparatively small, increasing to approximately 6 BCM by the mid-2030s and remaining broadly stable thereafter.
Taken together, these results show North America continuing to strengthen its position as the dominant LNG-exporting region in the global gas market.
In Summary:
The 26Q1 Base Case points to a global gas market defined by three distinct phases: a near-term period of market tightness and volatility driven by Middle East disruptions to LNG supply and elevated European storage demand, followed by a period of market rebalancing as new LNG capacity, led by North America, enters the market. Over the longer term, continued demand growth, particularly in Asia, gradually absorbs that new supply and contributes to tighter market balances once again.
In that sense, this outlook is not defined by disruption in the Middle East alone, but by the interaction of supply growth and regional demand trends. Together, these forces determine where gas flows and how global market balances evolve over time.
Global Gas Outlook: Exploring the Possibilities
The 26Q1 Base Case provides one path through a highly uncertain environment, but market participants must also evaluate how shifts in variables (the inputs), such as regional restart timing, infrastructure repair duration, Asian demand fluctuations, or severe weather, will alter the outlook.
The G2M2® Market Simulator for Global Gas and LNG™ is built to examine such changes. G2M2 can be used to run scenarios such as:
- Hypothetical new inter-regional import/export pipelines.
- New LNG import/export terminals and capacity expansions.
- Alternative scenarios of production capacity in existing or frontier supply areas.
- Severe or mild winter demand cases.
- New storage fields or increases in existing storage capacity.
RBAC’s market simulation tools can give insight into the natural gas market under a wide range of scenarios, including cases where geopolitics, infrastructure, demand growth, weather, or project timing move differently than expected. To discuss a scenario or schedule a free demonstration, contact RBAC.
RBAC, Inc. has been the leading provider of market fundamental analysis tools used by the energy industry and related government agencies for over two decades. The GPCM® Market Simulator for North American Gas and LNG™ is the most widely used natural gas market modeling system in North America. RBAC’s G2M2® Market Simulator for Global Gas and LNG™ helps users understand evolving global gas and LNG dynamics and the interrelationship between North American and global gas markets.