What Goes Up Must Come Down…
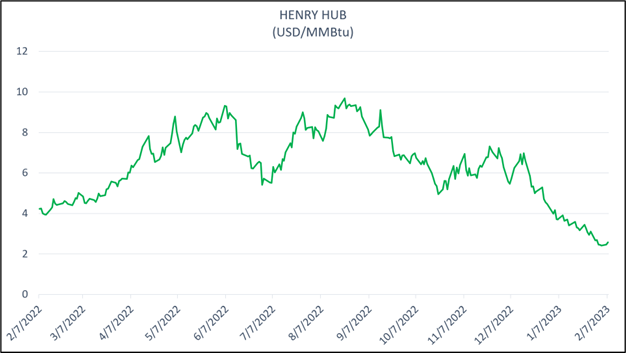
2022 was a turbulent time for natural gas prices, not only in Europe, but in North America as well. Monthly Henry Hub prices settled over $8/MMBtu twice, and over $7/MMBtu for five months straight, driven largely by geo-political uncertainty and whipsaw market fundamentals. Prices that had not been seen since the pre-shale era. But as the adage goes, “What goes up… must come down”, and we’ve seen that play out in natural gas prices this winter.
Henry Hub
Henry Hub prices have been turned on their head, dropping below $3/MMBtu, flipping age-old seasonality trends and causing no end of anxiety to this analyst, and his boss. The recent price movement down has been caused by a variety of factors including but not limited to production, weather, and the extended outage at Freeport LNG. But what comes next? Will prices remain low?
Production
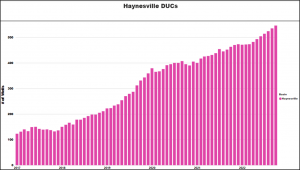
Lower 48 Production has been strong of late, hitting a record high of ~102Bcf/d. This strength is expected to continue through 2023, largely on the back of the Permian and Haynesville Shales. Both of those basins posting year over year gains and Haynesville having staggering additions in DUCs. They are well positioned for continued growth and opportunity given their infrastructure and proximity to export facilities. The same cannot be said for Appalachia, which has largely held flat along maintenance levels and likely will continue to until additional capacity like Mountain Valley Pipeline can come online.
 Source: https://www.eia.gov/petroleum/drilling, RBAC Visual Analytics[1]
Weather and Storage
Lower 48 weather has been “decidedly normal” so far this winter, with the exception of Winter Storm Eliot, the extreme cold burst in late December. Eliot thrashed much of the United States, causing a 30% supply drop off in Appalachia alone, a region long accustomed to cold weather.
However, unlike Winter Storm Uri, Eliot was short in duration and supply quickly rebounded. This normal weather paired with strong production has been a boon to storage levels. Smaller withdrawals and even an extremely rare winter storage injection have allowed levels to creep closer and closer to the 5-year high, and consumers wracked by inflation begin to breathe easier with sub-$3 Henry Hub prices cascading across the United States, except in California, where continued infrastructure constraints have kept prices higher without any relief in sight.
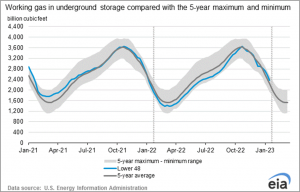 Source: https://www.eia.gov/naturalgas/weekly/
LNG
The much-anticipated resumption of exports at the Freeport facility is on the horizon. Off-line since June of last year, the facility represents a possible 2Bcf/d demand, shifting the L48 natural gas market fundamentals. Freeport released a recent statement that they have completed repairs as well as revision and implementation of new procedures and safety systems in order to safely resume initial operations. While this is good news, approvals from US Regulators could be the fly in the ointment. This comes at a time when European Gas storage levels are at record levels and demand for LNG Cargos has slumped. Pricing at Dutch Title Transfer Facility has also slid lower as of this writing, possibly already taking into account the upcoming additional supply from Freeport.
Conclusion
So, what could this mean for domestic end-users? Will prices low or will we see another price surge?
Weather has been mild, but Mother Nature is notoriously fickle. Analysts are watching with bated breath to see what happens next both here and abroad. We cannot entirely predict extreme weather events, such as Uri (which is coming up on its two-year anniversary next week) and certainly not upheavals such as the earthquake in Turkey and Syria. But we can be sure that the North American market is and will continue to be impacted by both domestic and global events.
Yet, as analysts and with market simulation, such as GPCM® Market Simulator for North American Gas & LNG™, we can run scenarios of even the most extreme cases. From severe weather such as Uri and Eliot to extreme disruptions or demand spikes such as lockdown or rapid re-opening of China, you can ask the question and get the answers. “What would happen to demand, supply or prices should the US experience another Uri, just as Freeport roars back online? Could there be a fresh development in Europe?”
Anything is possible… And GPCM could be used to predict the impact such a series events would have on prices, flows, even supply impacts. A powerful tool to keep your company nimble and ready for any single or cascading events thrown your way.
RBAC, Inc. has been the leading provider of market fundamental analysis tools used by the energy industry and related government agencies for over two decades. The GPCM® Market Simulator for North American Gas and LNG™ is the most widely used natural gas market modeling system in North America. RBAC’s G2M2® Market Simulator for Global Gas and LNG™ has been instrumental in understanding evolving global gas and LNG dynamics and is vital in fully understanding the interrelationship between the North American and global gas markets.
[1]RBAC’s Visual Analytics also has reports freely available. To find out more see RBAC Gas & LNG Visual Analytics – RBAC Inc.