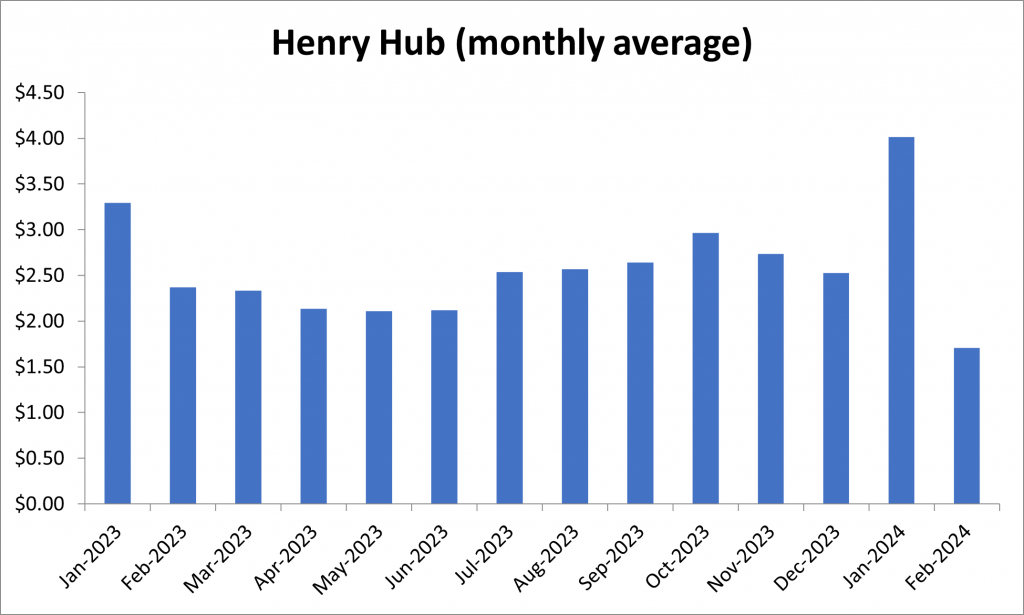
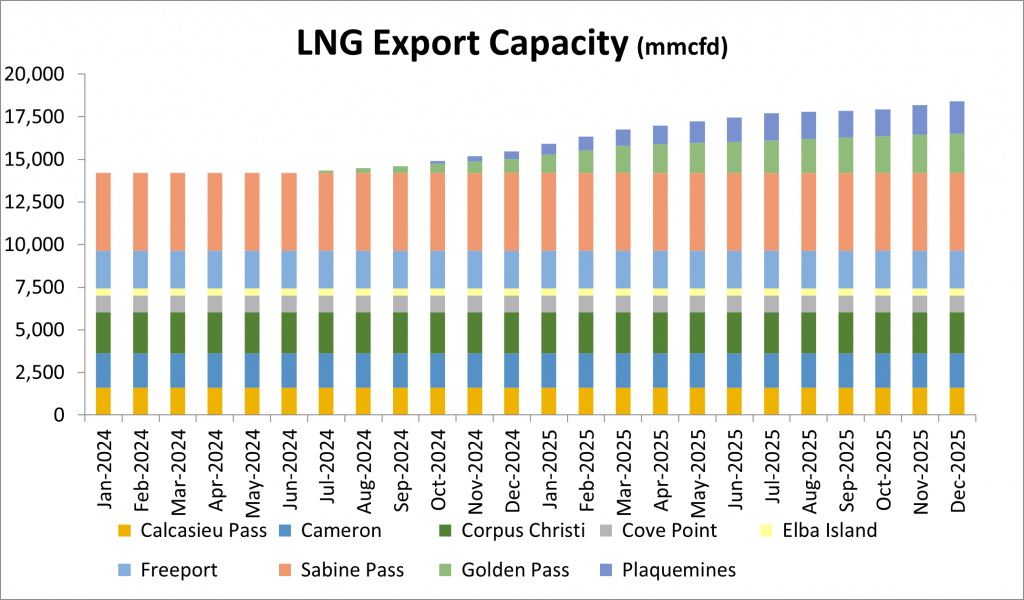
Much press has been given recently to the fall in natural gas prices from January 2024 to February 2024 and conjectures abound as to what that bodes for the rest of what is now essentially “shoulder” season. “Shoulder Season” has long been referred to as the lull period between winter space heating demand and summer electric generation demand. Typically beginning in April, this “Shoulder” season began early in part due to the gap in new LNG export demand coming online in the latter portion of 2024 and more in 2025. Specifically, Golden Pass and Plaquemines are expected to be in service later this year, and Corpus Christi has an LNG expansion scheduled to go in-service in 2026. So, over the next several months of 2024, we’re stuck with our current roster of LNG export facilities.
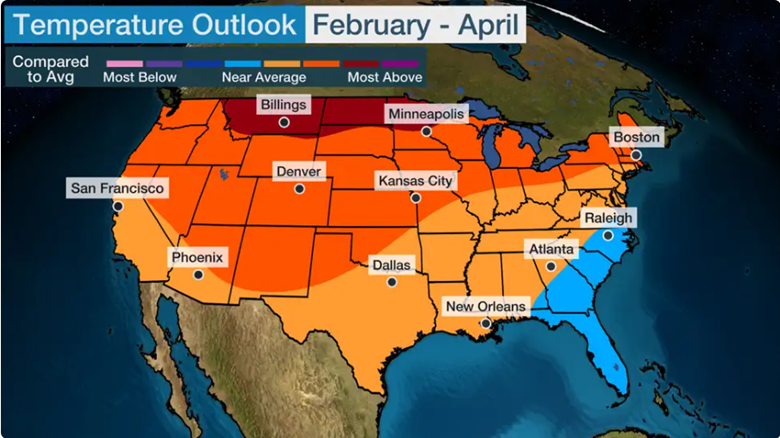
A few anomalies have also contributed to the precipitous price decline from January to February; such as an outage at the Freeport LNG export facility for one train’s motor replacement. In addition, a cold snap that lasted over a 4-day holiday weekend in January pushed daily Henry Hub prices to $13.20. The price magnitude offset the time brevity, and significantly weighted the monthly average up from what would have otherwise been about $2.65. Thank the El Nino-influenced mild weather in the US, particularly in the northern states, along with strong production (prior to the last month) for helping cap natural gas prices for the 2023-24 winter season.
Moving into February, low space heating demand, storage balances above the five-year average, lower LNG exports (as noted above), and strong production have been the recipe for low and soft prices. WTI prices above $70 have continued to encourage growth in associated gas volumes in anticipation of growing LNG export demand, which has been clearly visible on the horizon. Many gas-centric producers were hoping to make it through the soft price patch with minimal repercussions. However, the increased LNG demand is not here yet, and Mother Nature has been uncooperative (at least for the natural gas bulls), and consequently we’re stuck with this early “shoulder” season.
At some point, elasticity from either the demand side or the supply side, or both, was bound to exert itself. Within the last month, that’s exactly what has happened, and in this case from the supply side. Several producers like Chesapeake and EQT have voluntarily cut production, but is it enough?
The current fundamentals are likely to hang around for a good portion of 2024 unless we get some extended heat over the late spring and summer months or more supply reductions occur. Further Supply/Demand balance tightening appears needed to help shave off the storage overhang we currently have prior to next winter and/or more LNG exports coming online.
How can market participants prepare or plan for such early or sustained “shoulder” seasons, or in this case a “shoulder” year? Having a tool like the GPCM Market Simulator allows users to simulate supply/demand balances and pricing by easily constructing, executing and vetting multiple scenarios.
We at RBAC are following this closely and while you may not always know what is coming, scenario analysis will help you better understand the possible risks and have a plan ready for unexpected market trends and events.
RBAC, Inc. has been the leading provider of market fundamental analysis tools used by the energy industry and related government agencies for over two decades. The GPCM® Market Simulator for North American Gas and LNG™ is the most widely used natural gas market modeling system in North America. RBAC’s G2M2® Market Simulator for Global Gas and LNG™ has been instrumental in understanding evolving global gas and LNG dynamics and is vital in fully understanding the interrelationship between the North American and global gas markets.


