
Modeling the Impact of New Gas-Fired Generation in West Texas
West Texas is one of the hottest places for natural gas and electric generation, experiencing substantial growth in both supply and demand for each. The Permian Basin, sitting on the Western edge of Texas, continues to create plentiful gas supply in the region, to the point of depressing prices into negative territory. Meanwhile, gas-fired electric generation increased by 28.0% from 197,669 to 252,525 GWh since 2014, driven primarily by data centers (especially for AI applications), cryptocurrency mining, population growth in and around this area, and increasing electrification across the oil and gas industry.
Against this backdrop of plentiful supply and rising demand – developers, regulators, and opportunists are seeing green in western Texas, and several new power plants and projects have sprung up to take advantage of the favorable economic conditions. These natural gas power projects are being developed to provide both dispatchable power to meet peak demand as well as baseload power required by AI/demand center computing.
As discussed in our prior articles on Virgina and Texas, we continue to monitor and enhance our forecasts for electric generation. For those instances, we used a state level approach to model their predicted natural gas-fired generation, allowing us to adjust gas demand at a macro level. However, given the number and substantial size of these projects, we thought this would warrant an alternative approach, focusing on the individual customers.
Accordingly, we created several large electric power customers in West Texas as new customers in the GPCM® Market Simulator for North American Gas and LNG™, and then observed their impact on supply, demand, flows, and prices in the region.
Setting up scenario in GPCM
To create the projects, we used the GPCM Customer Builder, which enables users to incorporate a new natural gas customer and analyze how incremental demand affects pipeline utilization, how the facility could be supplied, and even create a gas price forecast for this new customer.
Using the information available on various projects in the area (e.g. CPV Basin Ranch Energy Center, among others, as inspiration), we made assumptions about the facility’s gas demand, where the gas would be sourced, and the in-service date.
In total, we modeled an additional five 230 MMcf/d power plants, coming online between January 2029 to December of 2030. Holding all other assumptions consistent with our 25Q4 Base Case, we then ran a scenario from 2018 – 2050 to see the effects the new demand would have.
Scenario Outcomes
All our hypothetical power plants are in or around the Permian Basin. As such, we would expect for much, if not all, of the increase in demand to be sourced from the abundance of supply there.
Figure A: Source Destination Flows (SDF) to the West South-Central Census Region, 2035
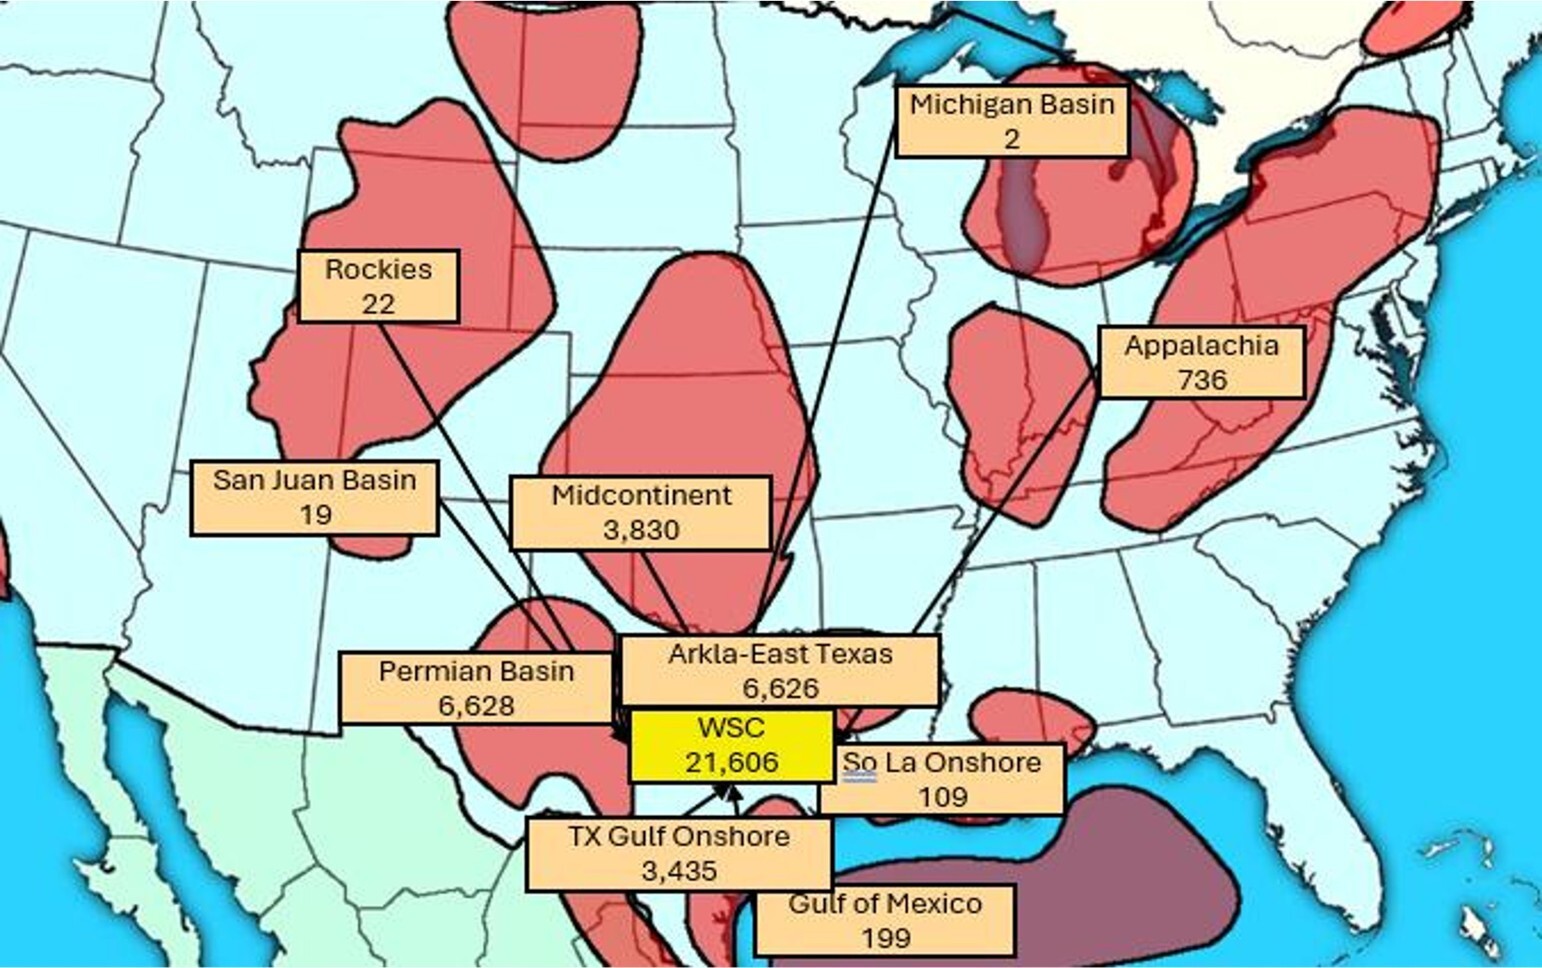
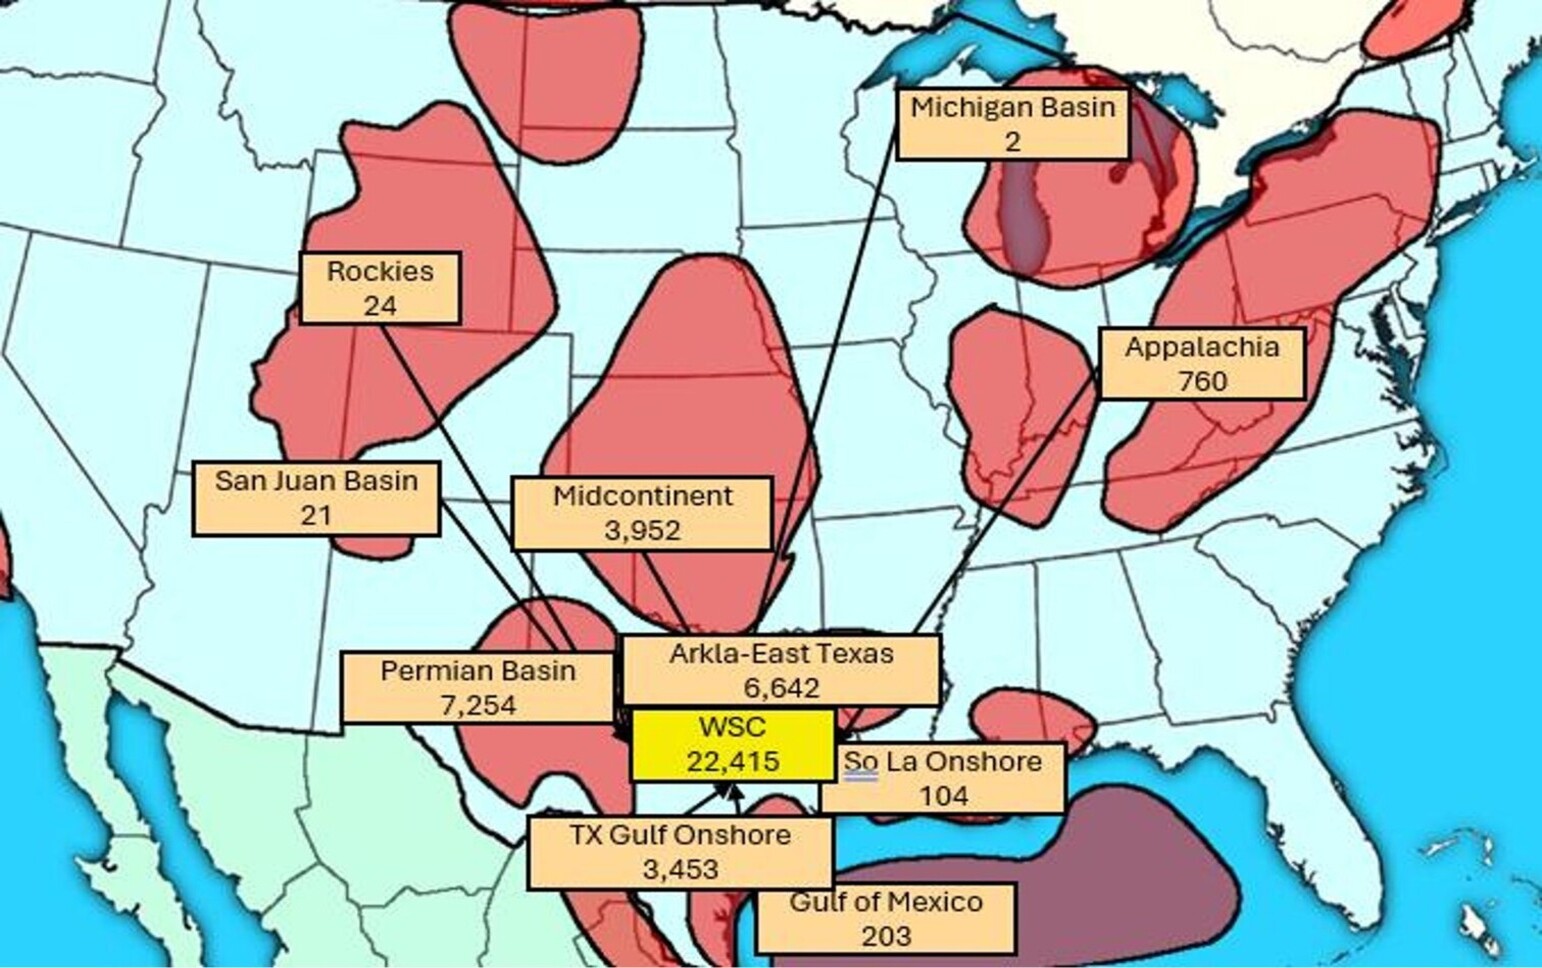
Using the Source Destination Flows (SDF) mapping tool, we can analyze how natural gas is supplied to a region/sector/zone following changes to different scenario assumptions. In the Power Plant Scenario, we see an increase in flows to the West South-Central (WSC) Census region, which serves as a proxy for West Texas and the Permian (Figure A).
In 2035, about 5 years after the start-up of our power plants, consumption in the WSC region is 22.4 Bcf/d in the Power Plant Scenario, compared to the 21.6 Bcf/d from our Base Case. Most of that gas comes from Permian Basin flow increases (~625 MMcf/d), and the remainder ~100 MMcf/d comes from the Midcontinent region.
Figure B: Source Destination Flows (SDF) from the Permian Basin, 2035
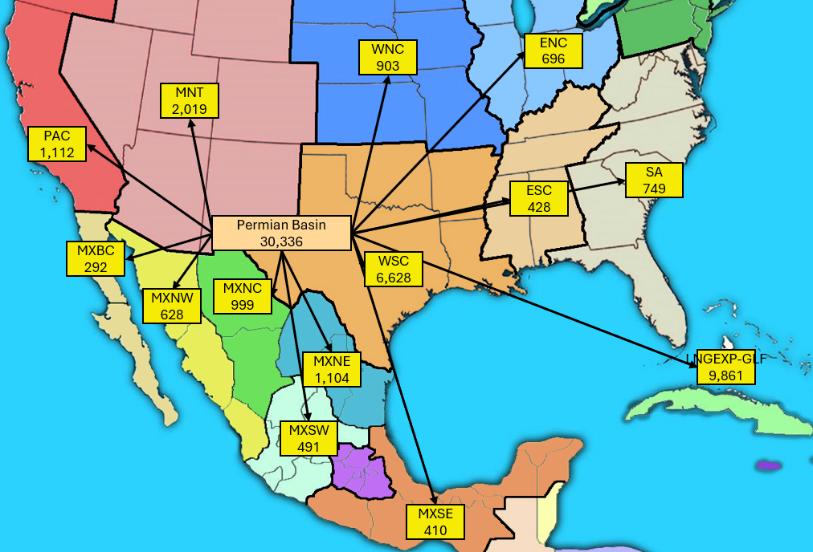
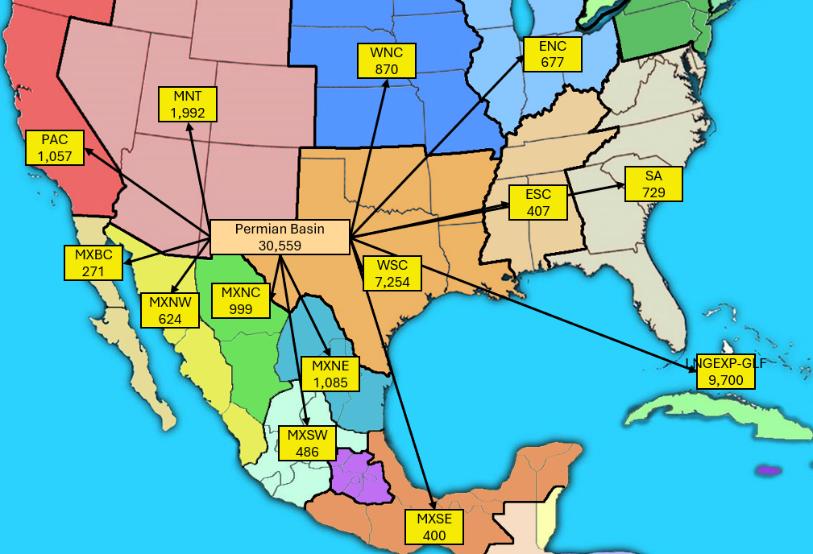
Zooming in on the Permian Basin, which had the greatest increase in flows to the WSC region, we can see both a production and demand response from the Permian and other regions (Figure B). For natural gas production, the Permian Basin produces about 0.25 Bcf/d more in the Power Plant Scenario than in the 25Q4 Base Case in 2035; that differential is consistent throughout the forecast period. Most of this production growth goes to the WSC region. Flows from the Permian decrease slightly to all other demand areas, with the largest decrease being the 55 MMcf/d decrease in flows to the West North Central region. In addition, deliveries from the Permian to Gulf Coast LNG exports decline by 161 MMcf/d in 2035 under the Power Plant Scenario.
Examining the Source Destination Flows (SDF) report again, we can see which basins, if any, increase flows to compensate for the Permian’s decrease in LNG. As it turns out, Haynesville output to Gulf Coast LNG exports increases only slightly, but enough to cover the shortfall from the Permian to that high demand area.
In sum, while the new demand spurs some slight production increase in the plant’s primary natural gas source (i.e., Permian), it also causes marginal flow decreases to other areas, and ripple effects across U.S. gas markets.
Figure C: Texas’s Annual Natural Gas Consumption for Electric Generation, 2025 – 2050, MMcf/d
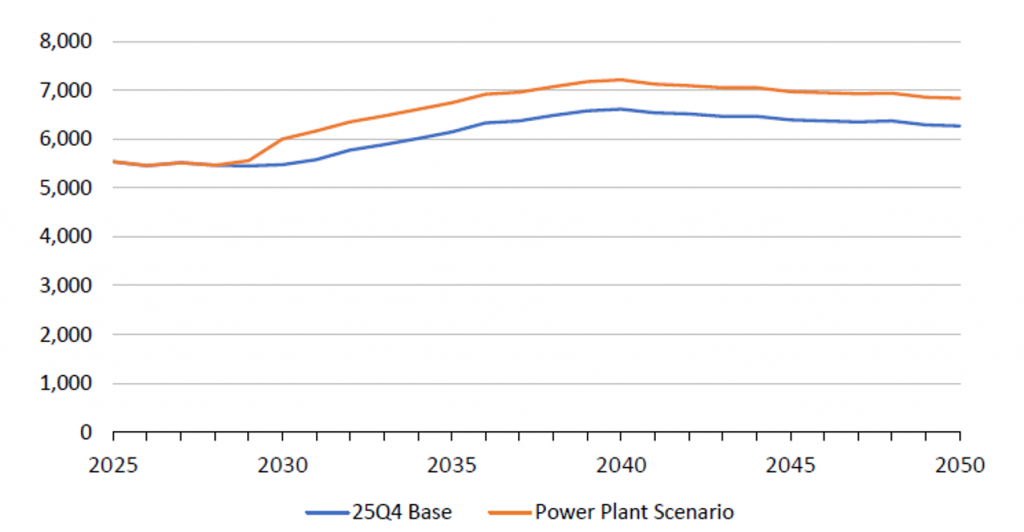
In terms of statewide demand, we can see that demand in the Power Plant scenario is higher than the 25Q4 Base case forecast (Figure C). Starting in 2029 (when the new power plants start coming online), demand is on average 0.6 Bcf/d greater than the Base Case throughout the forecast period. This demand increase is entirely due to the new power plant customer we created, as all other assumptions remain consistent with the 25Q4 Base Case otherwise.
Figure D: Annual Henry Hub and Waha Hub Prices, $/MMBtu 2030 – 2050
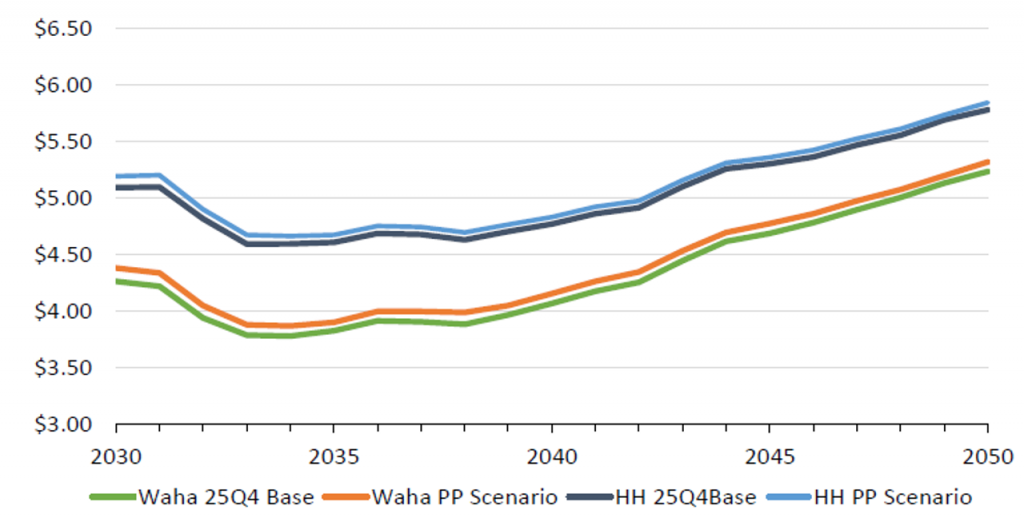
Comparing pricing at Henry Hub and Waha (Figure D), the incremental demand in the Power Plant Scenario results in a modest increase at both hubs versus 25Q4 Base Case.
From 2030 to 2050, the price at Henry Hub increases on average about $0.07/MMBtu, while the price at Waha Hub increases by $0.09/MMBtu. The price curve shapes remain largely consistent with the 25Q4 Base Case, aside from the slight stepwise increase due to the increased demand from the new power plants.
Conclusion
The addition of the natural gas power plant projects had a measurable impact on West Texas supply, demand, and prices.
While this analysis focused on adding power plants in West Texas, the same approach could just as easily be used to model other large loads, such as citing a new data center, or a large industrial customer needing natural gas for production.
One of the major benefits of GPCM is its flexibility – there are countless options for customization, through adding or excluding midstream infrastructure, increasing or decreasing supply assumptions. You could just as easily build a new pipeline and connect it to the supply source (here, the Permian) or create multiple demand links to different pipelines to model different flow scenarios, providing valuable market insights to use as business intelligence and informed decision making.
Interested to see how this would work with your own market scenarios?
Click here to schedule a software demonstration.
RBAC, Inc. has been the leading provider of market fundamental analysis tools used by the energy industry and related government agencies for over two decades. The GPCM® Market Simulator for North American Gas and LNG™ is the most widely used natural gas market modeling system in North America. RBAC’s G2M2® Market Simulator for Global Gas and LNG™ has been instrumental in understanding evolving global gas and LNG dynamics and is vital in fully understanding the interrelationship between the North American and global gas markets.