“No pain, no gain” is a saying often heard from gym rats. The motto means if you want to make gains, advance, get stronger, and become more resilient; you must be willing to suffer some pain. Through this suffering, muscles become strong, minds become better equipped to handle future challenges, assets are repurposed, skills advance, market share is gained, and perseverance is learned.
The U.S. energy industry, particularly the exploration and production (E&P) sector, has dealt with its fair share of pain, leading to gain, over the last decade and especially during the most recent 12 months. RBAC wrote extensively about the Covid-19 pandemic in recent releases and articles and its dramatic impact on energy supply, demand, and price. Similarly, the OPEC+ brief price war threw the global energy markets into disarray as crude oil futures prices traded negative for the first time. This black swan price event led to substantial production cuts and shut-ins among U.S. producers who were already experiencing a bit of financial gastric bypass. The history of easy financing to fund a ferocious drilling and completion appetite had been on a diet for a while and then came negative crude prices.
One thing that can be said about the U.S. E&P sector is that experiencing catastrophic events has left the survivors more financially sound and resilient. Continued efficiency and technological gains considerably reduced the break-even economics of drilling and completing wells. As crude oil prices collapsed from over $100/Bbl in 2014 to under $40/Bbl in early 2016, production dropped from approximately 10 MMBpd to 9 MMBpd. However, even with prices staying in a range mostly between $45/Bbl and $75/Bbl, production rallied over the next 4 years, peaking over 13 MMBpd. Likewise, natural gas prices were trading over $4/MMBtu and then dropped by 50% and stayed for the most part range bound between $2.50 – $3.50/MMBtu while production increased from under 70 Bcf/d to peak at just under 97 Bcf/d. Can one say, “Ingenuity and resilience”?
Figure I. Prices and Production
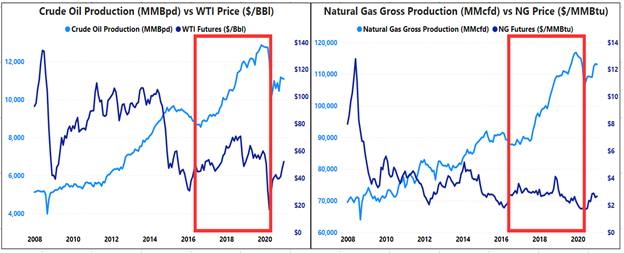
Source: Energy Information Administration
So just when things seemed to be turning the corner, February 2021 presents yet another black swan event, better known as the winter storm, “Uri”. Uri hit over the Valentine’s Day weekend and those that were planning on a nice candlelight dinner got more than they bargained for. Extremely cold temperatures descended upon the U.S Midwest and Texas the week prior and natural gas prices, in anticipation of much higher heating demand and much lower supply due to well freeze-offs, started to rocket higher. Early warning signs were sent via these price signals as the market had been conditioned from previous cold outbreaks (think polar vortices occurring over the last several years).
Unfortunately, as RBAC suggested in the article, “GOATs and ERCOT”, published on March 2, 2021, these warning signs may not have been heard or adhered to. A strange, but foreseeable feedback loop began to occur as well freeze-offs throttled back oil and gas production. Without the natural gas necessary to run baseload and reserve power generation units, especially as the sun wasn’t shining and wind turbines froze, the ERCOT grid became overloaded. Demand for space heating was record-breaking but the requisite power generation to meet this load was tripping offline. The lack of winterization and other preparedness measures were revealing a vital and disastrous weakness in the Texas (and other regions/states) electricity market. One might even call this the Gamestop/Robinhood equity market equivalent showing how things that seem to be obvious weaknesses, can go unrecognized or dismissed.
Figure II. Winter Storm Uri Freeze-Offs and Price Changes
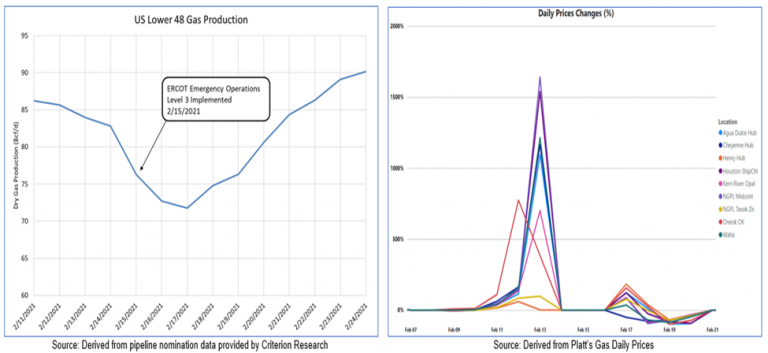
Source: Criterion and Platt’s
Yet again, things have settled back down, even though litigation related to Uri costs will no doubt continue well into the future. In fact, so will the replacement of personnel and policies to hopefully ensure such catastrophic outcomes can be avoided going forward. Crude oil and natural gas production continue to rebound and rig activity in the more economic basins are experiencing significant gains. The Permian basin is the primary focus of activity with rig counts nearly doubling from the 117 lows, and the Haynesville shale play has reached its pre-pandemic activity levels at 45 rigs and may soon be closing in on previous highs around the 60 level. Other areas are still languishing, so it’s not expected that crude oil will soon be hitting its previous production highs at over 13 MMBpd. But as oil wells age, their Gas-to-Oil ratio tends to rise. Combine gassier wells with declining break-evens for areas like the Haynesville and Marcellus, and natural gas production may be on the fast track to approaching previous record highs.
Figure III. Baker Hughes Rig Count by Basin (3Aug18 through 23Apr21)
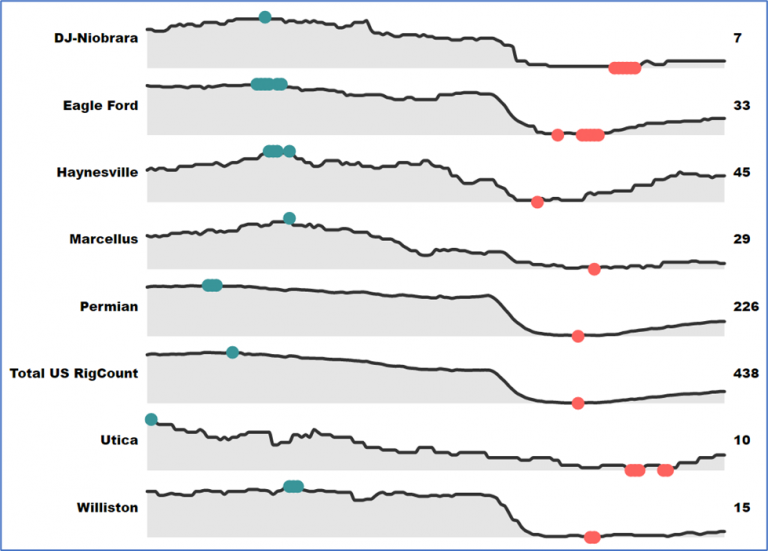
Source: Baker Hughes, RBAC
This may also just be what is needed as the U.S. economy continues to normalize. Economic growth has arguably been stellar since the middle of last year. Recall that GDP got crushed during 20Q1 and 20Q2, dropping -5.0% and -31.4%, respectively. The 20Q3 number spiked higher at +33.4% which was followed by a 20Q4 of +4.3%. The 21Q1 GPD data just released on 29Apr21 showed continued strength at +6.4 for the 1st read – all the above GPD numbers are annualized figures. Further supporting the expectations for future robust economic growth is the latest Chemical Activity Barometer metric, which is a leading indicator for industrial production metrics. The trend is indicating strong growth.
Figure IV. Chemical Barometer vs Industrial Production Index
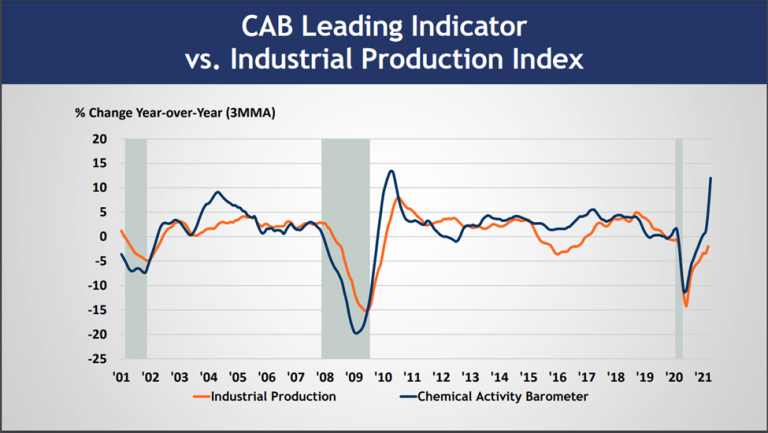
Source : https://www.americanchemistry.com/Jobs/CAB/short-term-1.pdf
U.S. Covid vaccinations are now over 230 million doses given and nearly 100 million people have been fully vaccinated. Savings rates are at very high levels and though unemployment is still relatively high, job openings surveys suggest tightening labor markets. This all bodes well for increased energy demand.
The U.S. appears to be in better shape than many economies in Europe and some of Asia, though China appears to be following a similar robust economic path as the U.S. Despite the slower recovery in Europe, they are experiencing a tight natural gas market situation based on storage volumes – which are about 20% below their 5-year average – and send out data. Having faced an oversupply situation last year, in part due to the pandemic’s impact on economic activity, the dynamics have shifted and indicate that there will be strong demand for LNG imports. Such strong demand is also being seen from Asia as the “Arbs” for both regions relative to the U.S. are open, meaning there’s an economic incentive to convert U.S. natural gas to LNG, load it on a vessel and set sail for these destinations.
Figure V. U.S. vs Europe vs Asia Natural Gas Prices
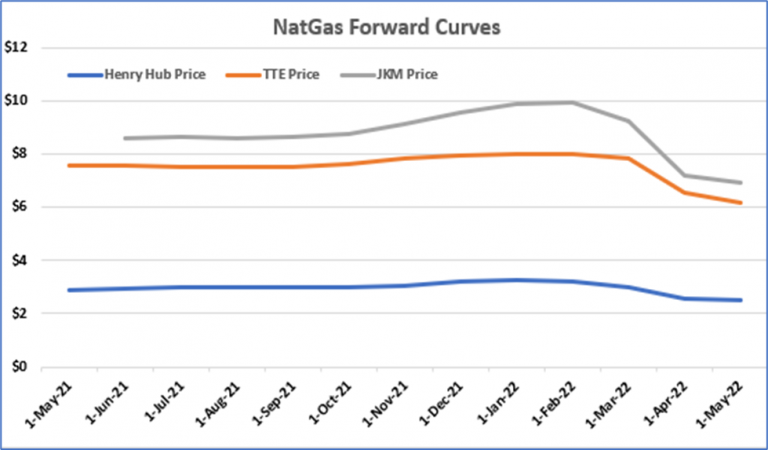
Source: Criterion Research, CME, RBAC
Now that winter is over and natural gas storage has switched from withdrawal season to injection season, bottoming out at just over 1.76 Tcf, the focus shifts to how things will balance throughout the summer cooling season. Will production rise enough to meet storage refill demand requirements, and what are those requirements going to be, getting to a minimum of 3.5 Tcf, 3.7 Tcf, higher? Will LNG exports remain at record levels, new records to come or will utilization decline, which does not currently seem likely given the Arbs? And finally, but not at all the least important, how will increased renewable power generation capacity in the form of wind and solar impact power generation gas burn this summer, and for that matter, future summers?
Such questions are relevant beyond the next summer and winter seasons since they impact decisions related to project expansions, new brown or green field FIDs, potential mergers and acquisitions and overall portfolio risk management.
Just as body builders, fitness buffs, and athletes know, one must push through the pain to realize the gains, with the end goal being a stronger and more sustainable performance.
RBAC’s GPCM® Market Simulator for North American Gas and LNGTM is designed to construct scenarios that address these questions. Our 21Q1base release incorporates the latest supply, demand, infrastructure, and tariffs data to produce our quarterly outlook, the price and LNG exports highlights of which are summarized below.
Similar to the maturing of the U.S. LPG export markets, U.S. LNG is becoming an increasingly important component of the supply and demand balancing equation for the U.S. natural gas market. Recent pipeline flow data show record LNG exports for that last several weeks. This trend is expected to continue as the Arbs remain open and storage levels in Europe remain below historical averages. When Asia demand is included, the call upon U.S. LNG exports is expected to remain strong at least through the summer and likely the end of 2021. As such, 21Q1base forecasts U.S. LNG exports to hold at or above the 10.0 Bcf/d level throughout 2021 and 2022, then accelerating in 2023 and beyond, before plateauing just under 18.0 Bcf/d. This top-end level is approximately the same as the 20Q4base but lower than previous outlooks maximum which exceeded 19.0 Bcf/d. This lower peak is directly attributed to turning off the Driftwood LNG Terminal from the 20Q4base outlook due to the project’s inability to attain Final Investment Decisions (FIDs). Additionally, the newly FID’d project on the Baja coast of Mexico, Costa Azul LNG, was turned on in 20Q4base and remains turned on in the 21Q1base.
Figure VI. LNG Exports (MMcf/d)
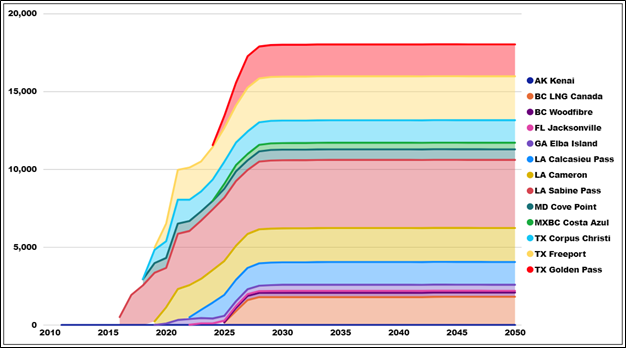
Source: GPCM
The 21Q1base price forecast has significantly increased vs 20Q4base driven by the higher industrial demand and LNG exports. Though production is expected to continue its rebound, pricing pressure will be required to ensure rig activity, and thus drilling and completion activity will continue to increase to meet the higher demand levels. Given the more restrictive financing environment, the natural gas market is operating more like a demand-pull than a supply-push structure. Though ingenuity, efficiency and technological gains are still driving down break-even economics, E&P’s focus on free cash flow (FCF), and funding CapEx through FCF, suggests prices may need to be closer to or exceeding $3.00/MMBtu to realize much higher production levels – though aging oil wells pushing higher Gas-to-Oil ratios will also contribute.
With 21Q1base price forecast exceeding $3.00/MMBtu for 2021 through 2023, supply will increase during this period as well. This ramp-up is further supported by crude oil prices exceeding $60/Bbl while the forward strips through 2023 exceed $55/Bbl. Furthermore, new gas pipeline takeaway capacity, via the Permian Highway Pipeline, is helping to evacuate gas from the Permian basin, where dry gas is effectively a by-product of crude oil production. New infrastructure and repurposing of infrastructure, along with pandemic related production declines, has created an underutilized infrastructure situation. So, for at least the next few years, it’s unlikely that takeaway capacity constraints will re-exert themselves. The challenge for Permian basin production will be the resource base potential and heightened regulatory issues which are starting to appear. In particular, the new administration has implemented a 60-day moratorium on federal land leasing and drilling. This will impact a large portion of New Mexico where a sizeable portion of the Permian basin resides. Additionally, areas of Colorado, Wyoming and other significant oil and gas producing states will be impacted. This raises the likelihood that either extensions of this moratorium, or additional prohibitive regulatory actions will be forthcoming. Which is further supported by the latest issues being faced by the DAPL crude oil pipeline in North Dakota.
Prices during this summer are expected to exceed $3.00/MMBtu (current NYMEX futures prices are on the cusp of doing this, currently trading around $2.95/MMBtu), and winter 2021/22 prices are expected to exceed $4.00/MMBtu. A similar seasonal pattern is expected for 2022 and into the beginning of 2024 but at lower price levels, though still holding above the critical $3.00/MMBtu. Increased production pressures pricing and by 2025, prices are back below $3.00/MMBtu.
As LNG export capacity starts to increase, utilization rates are expected to remain strong. This increased global demand for U.S. LNG coupled with continued strength in industrial demand, once again starts to tighten supply/demand balances leading to more upward pricing pressure. By 2036, the $3.00/MMBtu price level starts becoming fully in the rear-view mirror as prices move significantly higher throughout the balance of the forecast.
Basis markets in the primary supply areas will remain challenged over the long haul, in particular AECO and Dominion South see continued deteriorating basis markets – notwithstanding some short-term strength for AECO, specifically through 2023. This early strength is also seen at the WAHA hub as new pipeline capacity comes online, i.e., Permian Highway, which helps boost basis prices back toward the -0.20/MMBtu level. However, as production continues to ramp in the Permian basin, congestion starts to set in again, though not as extreme as experienced in recent history, pressuring basis back toward the -0.95/MMBtu level in 2040. Thereafter, basis starts to strengthen again through the forecast balance as supply starts to tighten.
Figure VII. Henry Hub Price and Basis Map (Real 2020 US$/MMbtu)
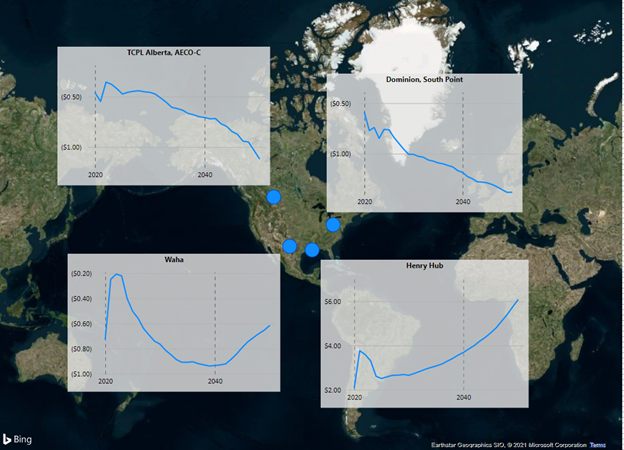
Source: GPCM
“May you live in interesting times” is befitting of the past year and a half for the energy industry. Crude oil prices have swung over $100/Bbl and currently look to be on the path of adding another $5 to $10/Bbl. Natural gas prices are back to nearly doubling from their lows and things appear to be looking brighter for E&P companies, or at least for those that have survived. Factor in the wild prices seen during the Uri winter storm, and it’s pretty clear that, at least in the cash market, anything can happen, and “interesting times” is a major understatement; downright frightful, or exciting (depending on one’s position) maybe more fitting. These extreme market movements only drive home the need for conducting scenario analyses, even scenarios that seem farfetched. RBAC’s modeling systems are designed to allow users to do just that, conduct a wide array of scenario analysis, altering supply, demand and infrastructure assumptions and quickly and easily execute simulations. The 21Q1base scenario is a snapshot in time scenario that serves as a starting point, providing users with an up-to-date database of supply, demand, infrastructure, tariffs, and cost components. Developed and released quarterly, the outlooks allow users to better simulate and identify risk, leading to more optimal risk management, hedging, and decision-making.