It’s only February, and already this year has experienced a whirlwind of changes, particularly for the energy industry. Starting with the weather, a polar vortex-esque Winter Storm named “Demi” blasted most of the U.S., dumping record breaking snow in some southern regions, including the Florida Panhandle, then blanketed the northern United States with sub-zero temperatures. Then, and not to be outdone by the weather, the 47th U.S. President took office, signing a flurry of Executive Orders, arguably impacting the industry much quicker and deeper than weather can do.
With orders ranging from LNG exports to drilling on federal lands, President Trump stayed consistent with much of his campaign rhetoric; including implementing tariffs on trading partners, particularly Canada and Mexico.
President Trump favored tariffs as a bargaining tool in his first term in office, and it may be similar this time around, except that tariffs on energy from Canada could be costly to his constituents. A 25% tariff on imports of crude oil and natural gas from Canada could have significant impact on the flows as well as the pricing of energy in states that border our neighbor to the north. A last-minute reprieve put these tariffs on hold for 30 days, so the risk of the President reintroducing them is lower, but not zero.
Much has already been made of the impacts this could have on crude oil, specifically from the prolific Canadian oil sands, which is a large source of supply to the U.S. So, concerns are justified; however, things may be getting a bit overblown. Yes, Canadian crude oil is a major supply source for US consumers, a cheap one at that. It generally trades at a discount to American crude when accounting for transportation costs and quality, as well as its smaller pool of global buyers. The quality of the crude is largely why this Canadian supply source will likely be carved out from Trump’s tariffs. This type of crude is compatible with the majority of refineries in the US, which are engineered to use heavy crude versus the lighter crude that is produced in the Permian Basin. The United States simply doesn’t have the geology to produce the heavy crude oil that Canada does. Yet, Natural Gas does not share this advantage…

There are numerous points where pipelines carry natural gas from Canada into the United States. In a given month, these flows can swing anywhere from 4 Bcf/d to over 7 Bcf/d, representing 4 – 7% of all US demand, with seasonality playing a big part. Northern States depend on inflows from Canada to mitigate price spikes during times of high demand. Implementing a tariff, which effectively amounts to a 25% surcharge on all gas coming across the border, would increase the cost consumers pay and could possibly reignite inflation.
Using GPCM™ (Gas Competition Pipeline Model), we can reasonably predict the ramifications and magnitude a 25% tariff could have. It is also possible to analyze the impacts of other tariff levels as well, or even retaliatory tariffs that Canada could levy upon the US. This is exactly the type of analysis that GPCM was designed for.
By adjusting individual pipeline costs to various levels, a unique capability and level of granularity, GPCM provides numerous reports and tables that can be tailored to almost any tariff scenario. To do this, we will be adding an 25% additional cost at every point that gas flows across the US/Canada border.
For this study, we used the annual value of natural gas at each crossing in 2024 as a starting point. While this isn’t a dynamic price, it can be used as an estimate going forward. It is important to note that this calculation must be done for each of the crossing points, as each is in a different geographic location.
New records are then created on the receipt side of each cross-border point with the 25% tariff value added and an effective date of February 2025–the first month a tariff could be implemented. After doing this for each of the crossing points we can run our GPCM tariff scenario.
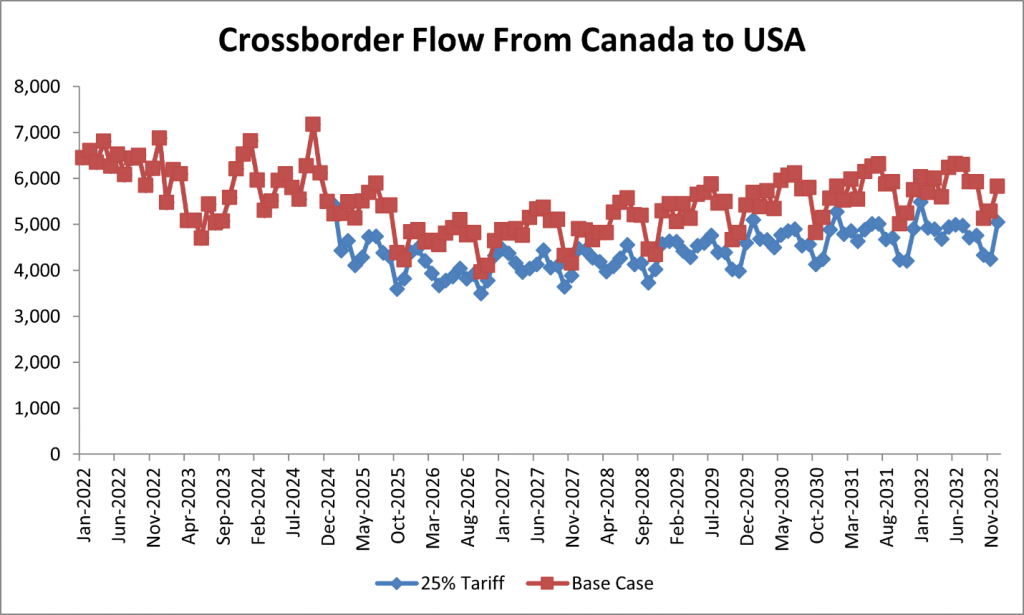
At a high level we can see that a 25% Tariff on Natural Gas Exports from Canada into the USA has an immediate impact on flows across the border. Over the next four years we see that, on average, cross border flows from Canada into the US are reduced by ~16% in this study.
It is important to note that there is a seasonality to these flows, which is an intuitive result, with the tariffs having a larger impact on summer flows (21% reduction). During periods of low demand like the summer months, the higher priced Canadian gas is priced out, i.e., less competitive. However, during periods of high demand, consumers effectively become price takers, consuming whatever is needed to stay warm, i.e., less price elasticity.
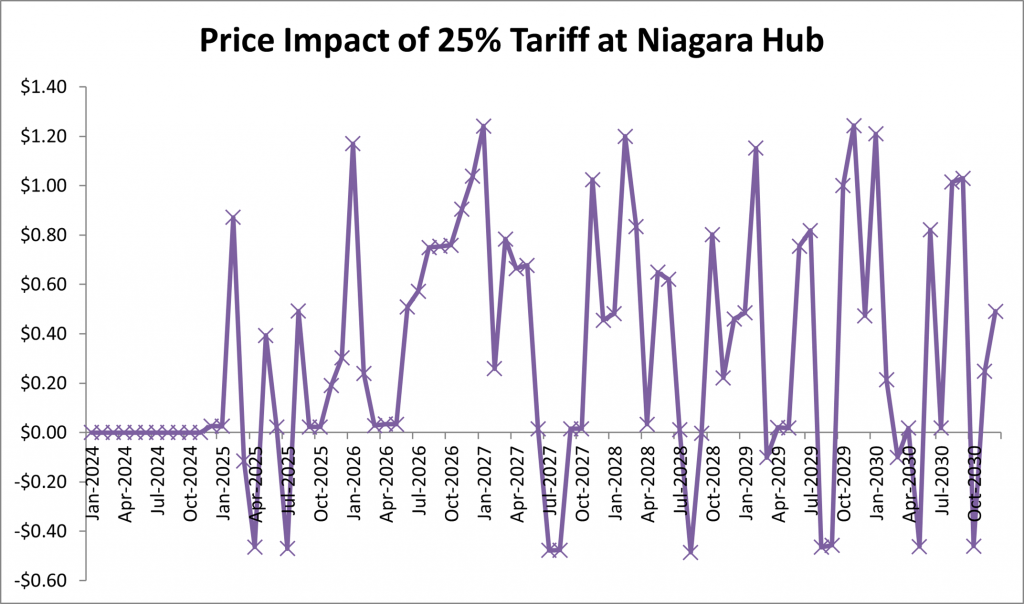
The impacts of this tariff are most drastic in the Niagara/NY regions, raising the cost of natural gas on average approximately 9% through 2032. As seen with flows, we see that there is a high level of seasonality with prices at Niagara. The tariff causes price spikes of up to 39% during periods of high demand like January, while periods of low demand see an average increase of 6%.
While tariffs have been used as a negotiating tool [with some effectiveness in the past] and parity between trading partners is desirable, the proposed tariff on natural gas impacts both sides of the border.
Both the Canadian producers and consumers in the United States end up paying the tariff. Other observations from this study are a decline in Canadian natural gas production, as well as an increase in domestic natural gas production. However, the domestic increase is not enough to offset the Canadian loss. This is likely due to pipeline constraints within the natural gas market.
RBAC, Inc. will continue to explore this scenario further with GPCM, including the impact that retaliatory tariffs could have. The natural gas market is constantly shifting and having the ability to do a scenario analysis with GPCM’s capabilities is an invaluable addition to any analyst’s toolbox.
RBAC, Inc. has been the leading provider of market fundamental analysis tools used by the energy industry and related government agencies for over two decades. The GPCM® Market Simulator for North American Gas and LNG™ is the most widely used natural gas market modeling system in North America. RBAC’s G2M2® Market Simulator for Global Gas and LNG™ has been instrumental in understanding evolving global gas and LNG dynamics and is vital to fully grasp and leverage the interrelationship between the North American and global gas markets.