Robert Brooks, Ph.D., President, RBAC Inc., March 2, 2012
As the gas industry rolled into the 21st century, natural gas production was beginning to decline and the outlook for production looked rather bleak. A small upsurge due to the advent of coal-bed methane development had begun to play out and it looked like the future lay in LNG imports. Billions of dollars were spent in designing and getting permitted dozens of new LNG import terminals. Ten new terminals and two offshore receiving stations were actually built. As it turned out, the companies that lagged behind and didn’t actually build these expensive terminals were the winners, because the industry as a whole did not predict an upstream revolution which was quietly occurring at the same time. A breakthrough in horizontal drilling combined with hydro-fracturing and advanced 3D imaging finally made it possible to economically develop the enormous gas and oil resources long known to exist in vast shale formations throughout much of North America.
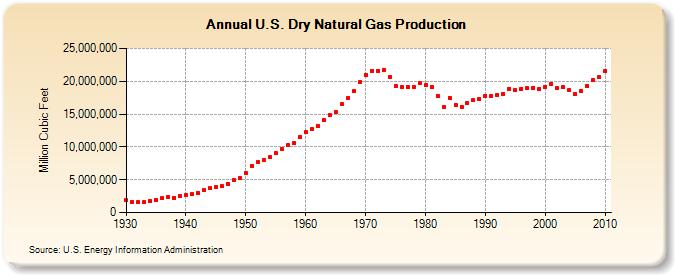
Figure 1: US Dry Natural Gas Production 1930-2010
A drilling boom began which completely turned the US production graph around. (See Figure 1.) All of a sudden there was more gas than could be easily absorbed in a recession-bound market. Natural gas prices began to erode, moving from the $6/mmbtu range to under $4/mmbtu (Figure 2), and the new challenge became “what are we going to do with all this gas?”
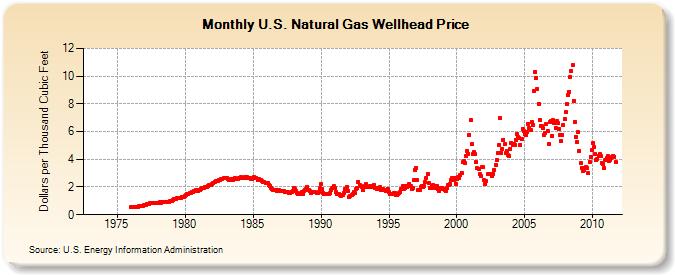
Figure 2: Monthly Natural Gas Wellhead Prices 1975-2010
Five answers have been put forward: redirect drilling from dry gas plays to plays having higher concentrations of more profitable natural gas liquids, replace coal with natural gas in electricity generation; build new fleets of natural gas powered trucks, buses, and cars; convert the gas into liquids for use in transportation; and, most recently, liquefy the gas and export it to other countries willing to pay much higher prices, notably Japan, China, Korea, and India.
As of year-end 2011 redirection to wetter gas plays has not solved the problem because the wetter gas plays have proven to be even more prolific gas producers than the dry gas plays drilled earlier. Replacing coal with gas in electricity production has been occurring but is a slow process which will take decades to unfold. Similarly, the natural gas vehicle market is growing, but from such a small base that it will take a very long time to have an impact on gas price, if ever. Gas-to-liquids is a mature technology, but is expensive, and its future in North America is still quite uncertain.
Up until very recently, the idea of liquefying excess North American natural gas and exporting it to overseas markets did not appear to be likely of success. That was before late 2011 when Cheniere Energy, owner of the Sabine Pass LNG terminal in Louisiana, announced the completion of agreements with UK-based BG Group and Spain’s Gas Natural Fenosa to export LNG to Europe and Latin America and with GAIL (India) Limited for similar exports to India. Each of these agreements is for 3.5 million tons of LNG per year. In January 2012, Cheniere and Korea Gas Corporation (KOGAS) announced a similar agreement for another 3.5 million tons per year. 14 million tons per year of LNG would require almost 2 billion cubic feet per day (bcf/day) of production.
Much or most of the gas to be liquefied into LNG would be produced out of the nearby Haynesville-Bossier Shale play of northern Louisiana and east Texas. Following upon these deals, Cheniere announced plans to convert its planned Corpus Christi LNG import terminal into a second liquefaction and export terminal, this one located near the prolific Eagle Ford Shale wet gas play in South Texas.
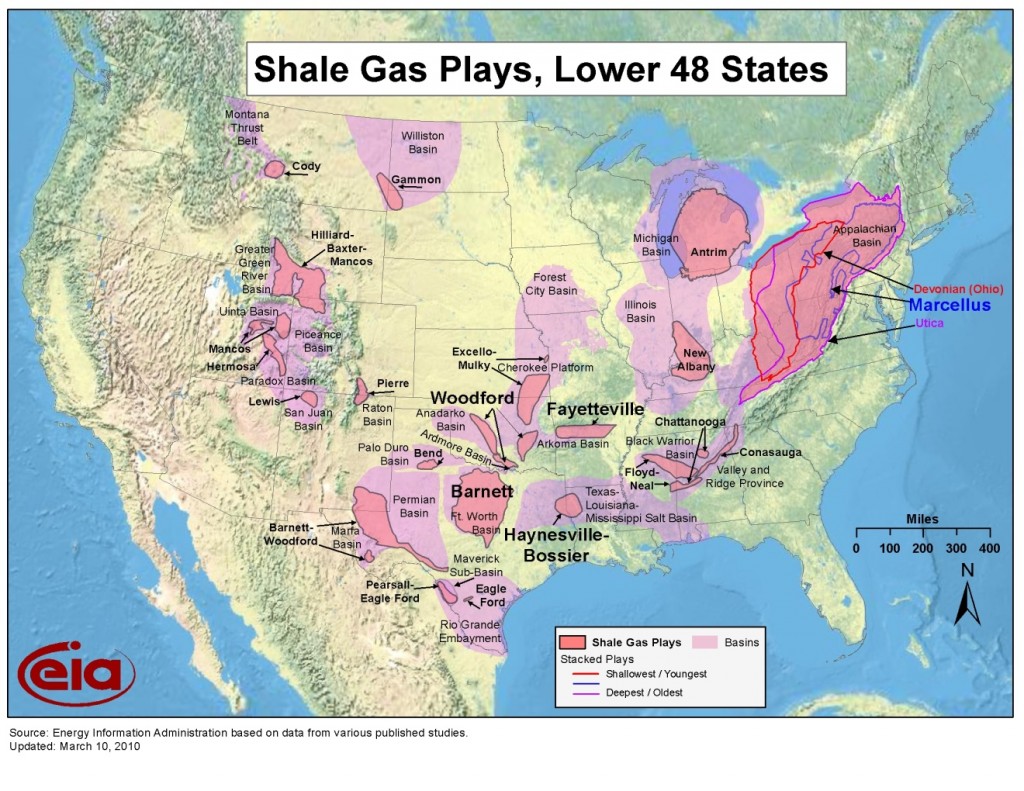
Figure 3: Shale Gas Plays in the United States
Some concern has been expressed by end-users of natural gas that these export projects would increase natural gas prices in the United States. Cheniere estimated that exports of 2 bcf/day could raise gas prices by as much as 10%. DOE’s Energy Information Administration was requested by Congress to make its own projection. DOE assumed a much more extreme range of exports between 6 and 12 bcf/day with two different ramp-up rates (1 bcf/day per year and 3 bcf/day per year). In their 6 bcf/day scenario with 2 year ramp-up, the so-called “low, rapid” scenario, EIA projected an average price increase at the Henry Hub in Southern Louisiana of $0.60 per million btu (mmbtu) over the period 2016-2035.
Using its WGM model with the assumption of a 6 bcf/day export volume, consultant Deloitte MarketPoint LLC projected an average increase of only $0.22 mmbtu at the Henry Hub in Southern Louisiana over the same time period as EIA. Deloitte attributed the tiny magnitude of this price impact to the ability of the North American gas market to quickly and efficiently adjust to the prospect of an export market.
Using the GPCM model RBAC has produced its own analysis to address this question. Starting with RBAC’s GPCM 11Q3 Base Case released in October 2011, which assumed Gulf LNG exports of 0.7 bcf/day, we have created five new scenarios: 1) no LNG exports from the US lower-48 states, 2) 1 bcf/day, 3) 2 bcf/day, 4) 4 bcf/day, and 5) 6 bcf per day. Each of the LNG scenarios took 3 years to ramp up to maximum by 2018 and continued at that level through 2035.
The following figures show the results from these scenarios and the impact of various volumes of LNG exports on prices at Henry Hub.
Figure 4 shows Henry Hub price forecasts for the five scenarios. Prices are expected to be in the sub-$4 range from 2012-2015 for all scenarios, varying from that point depending on the volume of LNG exports in each.
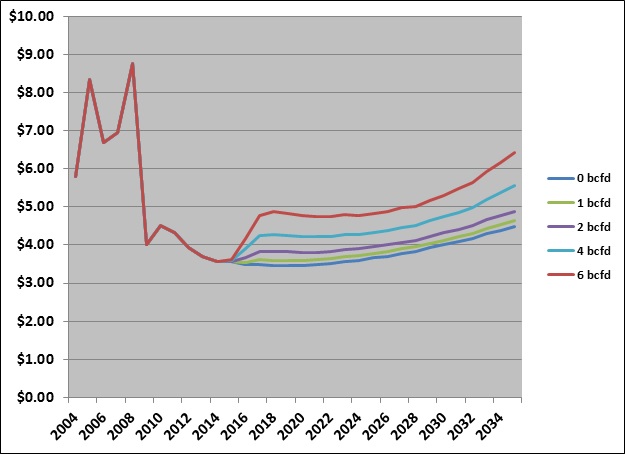
Figure 4: Annual Average Henry Hub Gas Price Forecast: 0, 1, 2, 4, and 6 bcf/day exports.
Figure 5 shows the price difference between the no-LNG and the 1, 2, 4, and 6 bcf/day scenarios.
Figure 6 shows the average price impact over the 20 year 2016-2035 time period of each of the LNG export scenarios versus a zero-LNG export scenario.
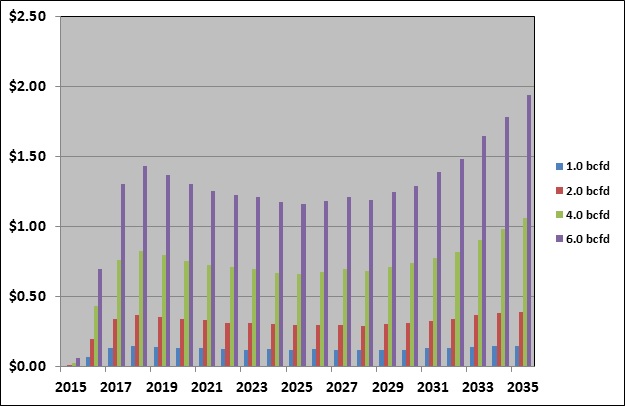
Figure 5: Price Impact at Henry Hub Due to Various Levels of Gulf Coast LNG Exports.
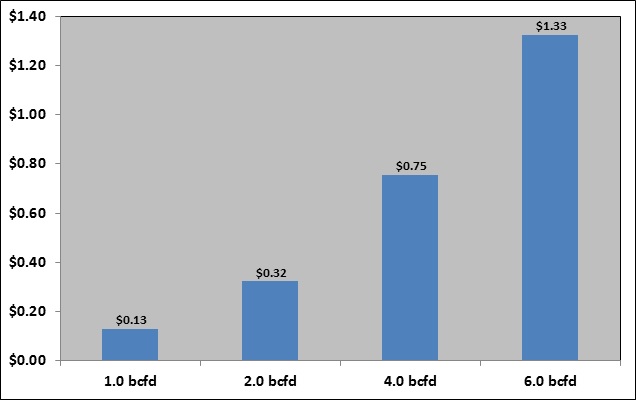
Figure 6: Average Price Impact at Henry Hub 2016-2035 of Different Gulf LNG Export Levels.
The price impact of this level of LNG exports predicted using RBAC’s GPCM model is about the same as Cheniere for the 2 bcf/day scenario ($0.32), but much greater for the more extreme 6 bcf/day scenario than that estimated by EIA ($0.60) or Deloitte ($0.22). It averages about $1.33 per mmbtu over the forecast horizon, a 30% increase at Henry Hub. RBAC’s 6 bcf/day scenario does not forecast that the industry will respond with speed and efficiency with an insignificant gas-price increase as does the Deloitte model. The flexibility of the industry to respond to this large and sudden increase in demand comes at a price.
The following figure shows the effect of this extreme level of LNG exports and resulting higher prices on domestic gas deliveries.
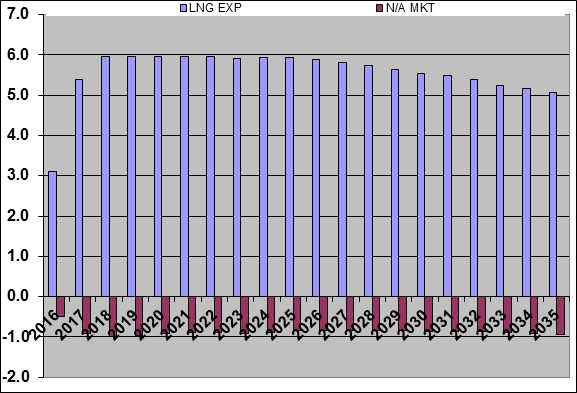
Figure 7: Impact of LNG Exports on Deliveries to the North American Market.
First note that the scenario as designed ran into difficulty exporting 6 BCF/day after 2025. The amount available for export slowly fell to about 5 BCF/day by 2035. The 6 bcf/day scenario assumes 3 bcf/day from Louisiana and 3 bcf/day from Texas. In the longer run, it is more difficult to supply 3 bcf/day for LNG exports from Texas due to competition with Mexico. On average the LNG exports were about 5.5 BCF/day in this scenario.
The addition of 5.5 BCF/day LNG export demand raises prices enough to reduce deliveries to the domestic North American market by almost 0.8 BCF/day. Most of this reduction is felt by the industrial market, the most price sensitive sector in the US. Thus the net additional production required by the new LNG export market is about 4.7 BCF/day.
Perhaps one reason why EIA’s price response is less than RBAC’s is that EIA assumes an increase in production of only 3.8 bcf/day will be required to supply 6 bcf/day in exports. This surprising result comes about because EIA’s result shows a 2.1 bcf/day decrease in gas available to consumers in the US. Their demand model is much more price-sensitive than RBAC’s.
Figure 8 shows where the additional supply will originate in the 6 bcf/day RBAC scenario. About 10% of the required new supply comes from coal-bed methane and a small uptick in LNG imports. The latter is due to the fact that the Mexican market is dependent on imports from the US as well as LNG. With less pipeline gas available to Mexico from South Texas, more local gas must be produced and more LNG imported.
One surprise is that conventional sources will initially provide about 50% of the incremental supply needed for the net increase in demand with shale providing about 40%. However, as shale becomes the predominant source of production, it also takes over as the primary source of incremental supply for exports, reaching more than 60% by year 2035. This may be more a result of the fact that GPCM models physical gas flows. How gas is contracted could be quite different.
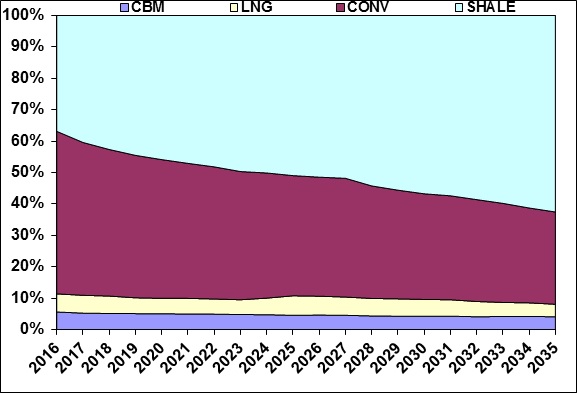
Figure 8: Share of New Supply Required in 6 bcf/day LNG Exports Scenario.
Sensitivity of Results to Supply Assumptions
A sixth scenario was run to test the sensitivity of these results to the base case assumption of supply responsiveness to changes in demand. By raising price sensitivity of supply for prices higher than about $4/mmbtu, production capacity grows faster than in the original 6 bcf/day LNG exports scenario. By 2035 capacity is about 4 BCF/day (3%) higher for the same price.
Figure 9 shows the effect of this higher production sensitivity case on Henry Hub price.
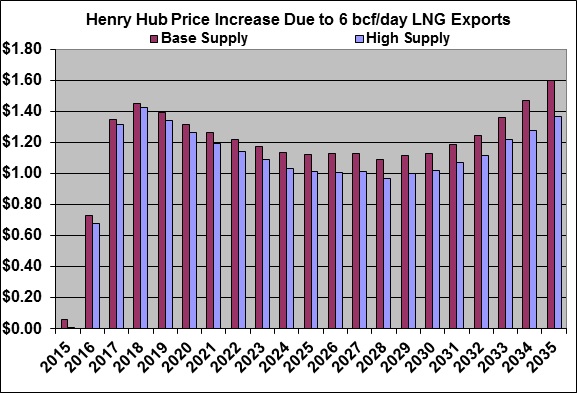
Figure 9: Sensitivity of Henry Hub Price Effect to Supply Capacity Growth.
The price effect of LNG exports is reduced by about $0.05 in 2016 growing to almost $0.25 by 2035. The average price effect in the sensitivity case is $1.13, about $0.10 less than the original 6 bcf/day exports case. These results suggest that both EIA and Deloitte models may substantially underestimate the price effect of 6 bcf/day LNG exports of the magnitude reported in their studies. The adjustments which the industry makes to meet the challenge of this large new demand are not likely to be made so quickly and with so little impact on price.
RBAC has been the leader in building the fundamental analysis tools used by the energy industry and related government agencies for over two decades. The GPCM® Natural Gas Market Forecasting System™ is the most widely used tool of its kind in its markets. RBAC other products include the G2M2® Global Gas Market Modeling System™, Gas4Power®, GPCM Peak Daily Demand Analyzer™, GPCM Viewpoints® on Natural Gas and NGL-NA® Model.