On February 4th, 2025, China imposed a 15% tariff on U.S. LNG. In our previous article we looked at historical LNG trade between these two countries and how the usage of tariffs between September 2018 and March 2020 affected the market. So, with 20/20 vision towards historical data and a look ahead to possible future outcomes with RBAC’s G2M2 Market Simulator for Global Gas and LNG, what might transpire over the next 4 years?
The worst-case scenario would be that the tariff policy leads to a complete halt in LNG trade between China and the United States. What would that look like? In 2024, U.S. LNG accounted for about 6% of China’s total LNG imports, while exports to China accounted for about 5% of total U.S. LNG exports. To assess the potential impact of this policy shift we will utilize the G2M2 Market Simulator for Global Gas and LNG to discover how a disruption in U.S. and China LNG trade may affect LNG exports from the US, LNG imports to China and the potential impact on global flows in other importing and exporting regions. Leveraging G2M2’s ability to easily model different scenarios, RBAC has created two scenarios to analyze a potential trade dispute with China:
Base Case: RBAC’s 24Q4 Base Case, a business-as-usual case, where the current state of LNG trade continues undisrupted.
Trade Disruption: Based on RBAC’s 24Q4 Base Case, but where LNG trade between China and the U.S. drops to zero and no LNG is traded between the two countries starting from March of 2025 until December of 2028.
It is important to emphasize that these scenarios are not forecasts or predictions regarding the impact of the tariff policies per se. Rather, they are scenarios designed to help readers identify trade patterns based on market shifts under different conditions using a sophisticated and robust model, grounded on market fundamentals.
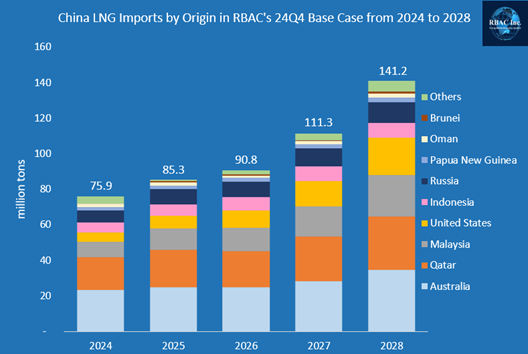
Chart 1: China LNG Imports by Origin in RBAC's 24Q4 Base Case from 2024 to 2028
As shown in Chart 1, in the absence of a trade disruption (our business-as-usual Base Case) U.S.-China LNG trade experiences steady growth in the coming years, particularly with the expansion of U.S. liquefaction capacity after 2027. China’s imports of U.S. LNG are expected to rise from 4 MTPA (6% of total) in 2024 to 21 MTPA (15% of total) in 2028. Out of the remaining sources of LNG imports into China during this time, the majority of China’s LNG supply is expected to come from the Asia-Pacific region and Qatar.
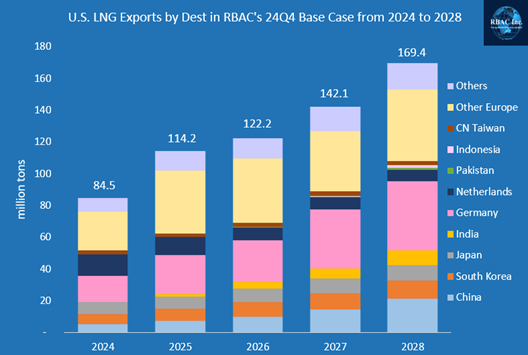
Chart 2: U.S. LNG Exports by Destination in RBAC's 24Q4 Base Case from 2024 to 2028
At the same time, in our Base Case, U.S. LNG exports are expected to steadily increase in the coming years, as shown in Chart 2. By 2028, U.S. LNG exports to China are expected to reach 21 MTPA (12% of U.S. total) while nearly 96 MTPA (57% of total) is expected to go to Europe.
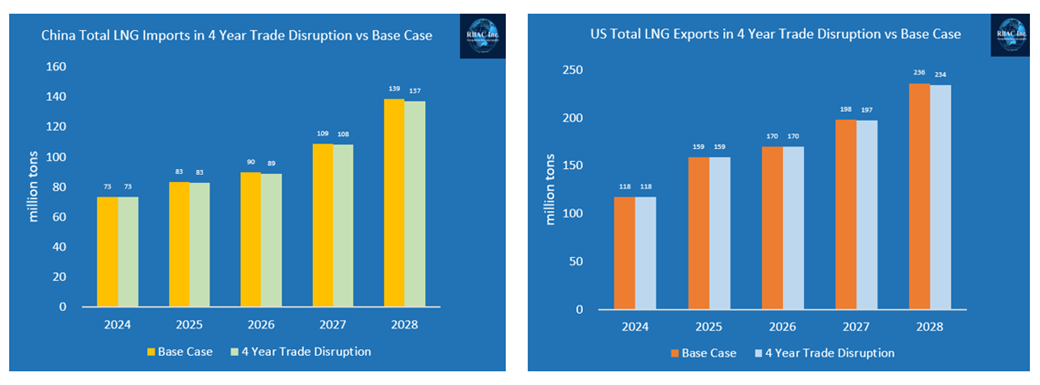
Chart 3, 4: China Total LNG Imports / U.S. Total LNG Exports in Trade Disruption vs. Base Case from 2024 to 2028
However, as shown in Charts 3 and 4, when U.S. to China LNG trade is suspended (Trade Disruption scenario), both China’s total LNG imports and U.S.’s total LNG exports are expected to remain relatively unchanged from the Base Case. Between 2024 and 2028, in only a few years does the Trade Disruption Scenario show slightly lower volumes than the Base Case scenario (business-as-usual).
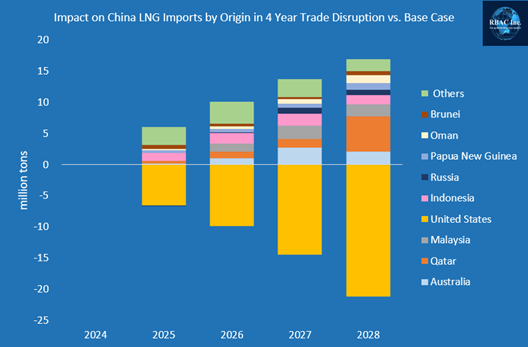
Chart 5: Impact on China LNG imports by Origin in 4 Year Trade Disruption vs. Base Case till 2028
What noticeably changes, however, is the shift in sources of supply to China from various exporting countries when U.S. to China trade is halted. Chart 5 shows the change in China’s LNG imports by origin country between the Base Case and the Trade Disruption scenario. As can be seen in this chart, by 2028, the trade disruption is expected to cause a decline of ~22 MTPA of LNG from the U.S to China. The 22 MTPA loss of U.S. LNG supplies, however, is expected to be made up for by an increase of imports from Middle eastern and Asia-Pacific countries, most notably, Qatar, Australia, Malaysia and Indonesia.
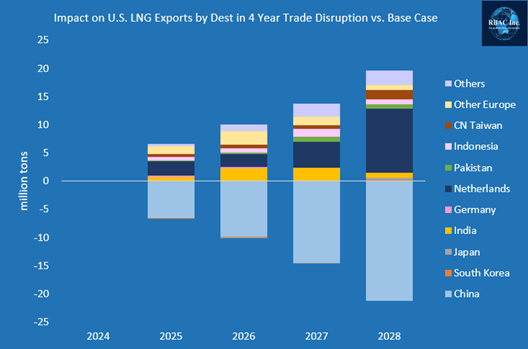
Chart 6: Impact on U.S. LNG Exports by Destination in 4 Year Trade Disruption vs. Base Case till 2028
By contrast, chart 6 shows the change in US LNG exports by destination country between the Base Case and the Trade Disruption scenario. As can be seen in this chart, the drop in US exports to China in the Trade Disruption scenario are expected to be offset primarily by increases in U.S. LNG exports to European countries, with several Asian countries offsetting the remaining volumes.
In conclusion, RBAC’s G2M2 market simulation shows that a tariff policy resulting in a halt in LNG trade between the U.S. and China will likely have a minimal impact on the total volume of U.S. LNG exports and China’s LNG imports, while there could be a significant impact on the direction of LNG trade flows globally.
RBAC’s G2M2® Market Simulator for Global Gas and LNG™ was utilized for this commentary for modeling and forecasting and is an indispensable tool to anyone looking to see how the potential disruption of gas supply into China (or other countries) would affect LNG flows in regional and global markets.
G2M2 can assist energy professionals, executives, analysts and policy makers to find the best ways to achieve energy security, as well as better investments, both in supply and production, through robust market analysis and better strategic decisions.
Interested in learning more about G2M2? Contact us here for more information and to schedule a free demonstration.
RBAC, Inc. has been the leading provider of market fundamental analysis tools used by the energy industry and related government agencies for over two decades. The GPCM® Market Simulator for North American Gas and LNG™ is the most widely used natural gas market modeling system in North America. RBAC’s G2M2® Market Simulator for Global Gas and LNG™ has been instrumental in understanding evolving global gas and LNG dynamics and is vital in fully understanding the interrelationship between the North American and global gas markets.