The 19Q3base quarterly GPCM database has been loaded to the RBAC website for download.
Highlights of 19Q3base:
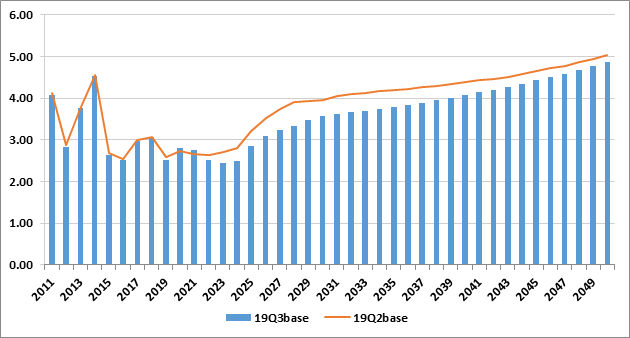
Henry Hub
- Henry Hub price level is lower overall due to:
- Higher Supply Outlooks for Permian and Haynesville shale in close proximity to Henry Hub
- Lower LNG export forecast in the 2022-2040 time period.
Henry Hub Price Forecast (USD per MMBtu)
Supply
- North America dry gas production is forecast to grow from 113 Bcf/d in 2019 to 144 Bcf/d by 2050, averaging less than 1% lower production than last quarter’s release
- Permian and Arkla-East Texas are the primary drivers of increased production while Appalachia growth has been reduced relative to 19Q2 as a heightened focus on capital expenditures and free cash flow throttles back spending in more gassy basins
- Arkla-East Texas production has been revised further to better reflect the production rebound in Haynesville shale, and as new midstream infrastructure will increase takeaway capacity and outlets to LNG facilities along the Gulf Coast
- Canada production forecast has been revised downward due to more conservative expectations for supply growth in British Columbia and Alberta
- Mexico production was reduced throughout the forecast due to improvements in the supply modeling processes and more accurate production decline curves
- Supply modeling processes have shifted to direct mapping to, and usage of, Rystad’s 3-stream production dataset (Dry Gas Production) for states covered by Rystad
- Rystad data correlates and matches in magnitude very well with EIA dry production data at the state level
- Rystad data is more stable and accurate at the well type level (Gas Well, Oil Well, CBM, Shale) in contrast to EIA, which enhances stability and accuracy when mapping directly to GPCM regions
- For states outside of Rystad’s purview, state data (I.E., websites) or EIA data is used to generate GPCM region equivalent time series which are then normalized to EIA’s state-level dry production data
- We’ve implemented a new Supply Outlooks methodology and process in conjunction with the shift to direct Rystad/GPCM Supply Targets mapping
- Streamlines the entire supply side development processes
- Provides for more accurate forecasts based on industry standard growth and decline curves
- Logistic or binomial growth
- Exponential, Hyperbolic, Harmonic, or Logistic decline
- Provides greater transparency and user friendly spreadsheet based approach
Demand
- Industrial sector regression demand models for Massachusetts, South Dakota, and all of Canada were updated this quarter
- U.S. impacts were minor, but the revisions materially reduced Canadian industrial demand by nearly 1.0 Bcf/d by 2050 relative to last quarter’s release
- In the US, lower natural gas prices increase overall power sector demand, though all sectors see slightly higher demand this quarter vs 19Q2
- The previous quarter’s lower Canadian gas-fired generation outlook for Canada from NEB (Canada’s National Energy Board), remains in effect for 19Q3; although residential and commercial sectoral demand are higher with adjustments to Residential and Commercial demand in Alberta Residential, Manitoba Residential/Commercial, Nova Scotia Commercial, and Ontario Residential/Commercial due to stronger recent actuals that are not part of the last update of Canadian Residential/Commercial regressions done for 18Q4base; these gains are not enough to offset the lower industrial sector demand, resulting in overall consumption being lower by approximately 1.0 Bcf/d
- Mexico’s natural gas demand marginally increases from the industrial and power sectors due to lower gas prices
- Lease and Plant Fuel demand decreases somewhat due to slightly lower dry gas production primarily in Canada and Mexico
- Demand in the 1st 6 months of the forecast was increased in the Demand Case Builder as the NOAA weather outlooks that are used for that period are more bearish than current actuals and future weather forecasts
- North American total natural gas demand increases early in the forecast period as the demand gains in US power and industrial sectors more than offset the drop in Canadian industrial demand through 2036; thereafter, the lower industrial demand is enough to drive total consumption lower relative to last quarter’s release
Physical Impacts
- The explosion in Lincoln Co, KY that impacted the Texas Eastern pipeline has been built into the model and updated with nomination flows.
- The explosion that impacted Westcoast pipeline in the Prince George area has been built into the model and updated with nomination flows.
- The SoCal system has been updated to include the Aliso Canyon Storage capacity changes and maintenance on lines 3000 and 235-2 to more closely reflect actual capacities, improving modeling results.
LNG Export Facilities
- LNG Rio Grande and the feeder pipeline Rio Bravo have been added and turned OFF.
- LNG Jacksonville and the feeder pipeline Peoples Natural Gas have been added and turned ON with very low demand.
Infrastructure
- Extensive review undertaken of the Waha and Permian areas of infrastructure to improve basis fits in the Southwest with some significant improvement realized in 19Q3base (Waha) and additional enhancements expected in 19Q4.
- Atlantic Coast, CFE Sur de Tejas to Tuxpan, MIDSHIP, Pecos Trail, Permian Highway, and PENNEAST have had their in-service dates changed to reflect delays.