There is a lot at stake in the current natural gas environment that impact not only the natural gas players but the entire energy industry. To realize how much is at stake, we only need to look back a week to an article from the Wall Street Journal discussing Chevron’s $10 Billion write down. The write-down was largely attributed to natural gas related assets, more specifically to their acquisition of Appalachia based production assets and their Kitimat LNG project located in British Columbia, Canada. Chevron’s asset revaluation follows write downs by other major players (e.g., Repsol and BP), and further raises concerns of yet more devaluations to come — think Exxon’s 2010 purchase of XTO which has already taken a $2.5 billion hit.
Image from Fluor: https://www.fluor.com/projects/kitimat-liquefied-natural-gas-epc
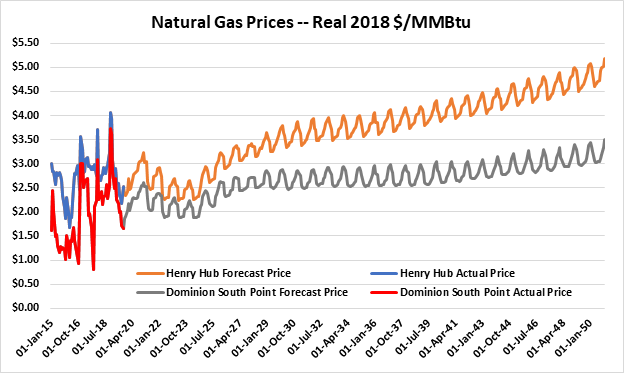
Followers of natural gas are well aware that low prices have persisted in the U.S. for the last four years. If we define “low prices” as being $3.00/MMBtu or less, using a monthly average of daily prices, prices have been even more troublesomely low in the Appalachia basin where Dominion South Point prices have spent a good portion of the last four years below $2.00/MMBtu. In fact, sub-$1.00 prints have also been seen on some occasions. However, four years ago, many industry participants, including investors and bankers who were doling out the equity and debt financing that helped drive production higher missed all the signs of the coming price environment we’ve been witnessing. But times have changed, and certainly forward curve prices for natural gas (as per CME futures) have provided some of the impetus for these changes, as prices do not exceed $3.00/MMBtu until January 2028 and then only for that month. The financial markets are now forcing producers to focus more on free cash flow, which has resulted in a significant throttling back of rig deployment. This will eventually lead to lower production in the gassier plays such as parts of the Marcellus where only the Southwest portion exhibits wet gas characteristics (rich in NGLs, which provide an uplift to returns). As Figure 1 shows, RBAC’s GPCM® 19Q3 Basecase forecast expects that it’ll be some time before languishing natural gas prices see any meaningful appreciation. The forecast shows Henry Hub prices will not exceed the $3.00/MMBtu mark until 2026, and that Dominion South Point will not reach that mark until the mid-2030s.
Figure 1: 19Q3 Basecase natural gas price forecast
So, what sectors are going to provide the much-needed demand boost to offset these stubbornly low prices?
One should not hold their breath expecting either residential or commercial gas demand to take up the slack. Weather sensitive demand from these sectors has been essentially flat on an annual basis for years. The most likely boon for natural gas demand can be found in LNG exports and the power generation sector. The real question is: how can you determine where the risks and opportunities lie within these two sectors? Each of these sectors face their own challenges. The power generation sector is facing a tremendous uphill battle on the green initiatives front. Large and influential states such as California and New York have each put forth legislation to significantly reduce the amount of fossil-fuel based power generation. LNG exports have faced similar opposition from these green initiative agendas. This just adds to worries about global gas demand and competition that are at the forefront of market participants’ decision making, especially in the short-term.
As our colleague, Dr. Ning Lin, pointed out in her recent article, “Who provides the greatest value for US LNG – A deep dive into LNG imports for Asia”, there are high expectations for U.S. LNG exports, but as noted above, there are several concerns on this front. With contract re-negotiations on the horizon, global competition is exacting a toll. Subsequently, the next wave of US LNG export terminals’ take-or-pay provisions, and the resulting expected IRRs, will likely look quite different than the PSAs signed during the first wave of U.S. LNG negotiations. Furthermore, global supply/demand balances are currently expected to be loose over the next few years, suggesting competition to supply end-use markets, especially China, is going to be quite fierce. Obviously, this won’t bode well for U.S. gas centric producers, at least in the short-term. Those producers in oilier and/or rich gas areas will still see decent rates of return, since the oil and/or NGLs production revenues are the real drivers of revenues, returns, and ultimately free cash flow. Natural gas in these areas is essentially a zero-price by-product.
Figure 2: 19Q3 Basecase US natural gas production forecast
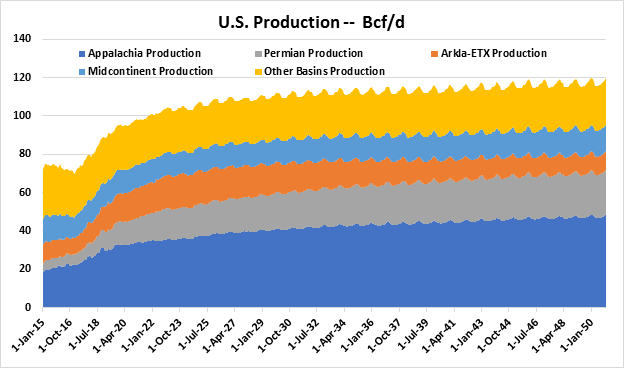
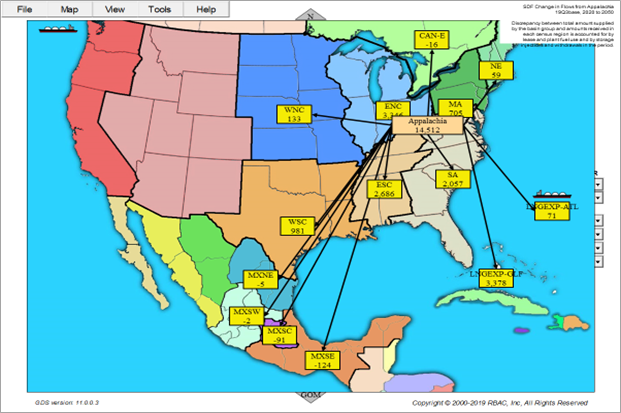
RBAC’s 19Q3 Base Case production forecast, shown in Figure 2, still calls for growth in the Appalachian Basin, but the main driver of gas production growth is unsurprisingly the Permian Basin where production is expected to double. Unless crude oil prices falter below $50/Bbl for an extended period, which the CME forward curve does not show occurring at least through December 2030, the Permian and other oil-focused plays will continue to garner the most attention and investment. Thus, it’s also not surprising that Chevron and other major E&Ps are shifting focus, recalibrating operations and their balance sheets toward these areas. The shifting landscape will lead to changing product flow dynamics especially as more clarity develops around LNG contract negotiations, FID decisions, and asset divestitures/acquisitions. Using RBAC’s GPCM Graphical Display System, one can quickly visualize such changes. Figure 3 provides a snapshot of the expected change in Appalachia supply source flow destinations between 2020 to 2050.
Figure 3:Appalachia source destination flows: change from 2020 to 2050
When analyzing real world scenarios, it is vital to have access to a modeling system that allows one to quickly view dynamic outputs, have full transparency of assumptions and vital information, as well as the capability to run a series of sensitivity scenarios quickly. The GPCM® Natural Gas Market Forecasting System™ allows the user to easily re-work supply assumptions to reflect a scenario whereby gassier plays see a more significant reduction, while oilier plays maintain or enhance their supply dynamics. For instance, a very simplistic scenario would be to lower the Appalachia Basin supply curves by 10%, and, conversely, increase the Permian supply curves by 10%. Alternatively, a higher precision scenario could be designed which reduced dry Marcellus shale production in NE Pennsylvania while increasing associated Permian production in Texas RRC District 8 only. GPCM is designed to allow users to determine where and when constraints are expected to arise given existing and planned pipelines including how price and basis are impacted – think WAHA prices/basis over the last year. But it also has functionality that allows additional pipeline capacity to be added automatically where expected demand would justify it. Similarly, this feature can be used to delineate the risks and opportunities associated with LNG export terminals under various scenarios.
Market dynamics are changing swiftly. There is a heightened focus on LNG exports and financial stewardship, but also the threat of aggressive green initiatives that could dramatically impact natural gas markets. In such an environment, it’s imperative that natural gas market participants, domestically and globally, have access to tools they can use to quickly and accurately analyze various scenarios impacting their business. This includes not only domestic supply and demand, but also infrastructure constraints, regulatory considerations, and ever more importantly international supply/demand balances.
RBAC provides modeling systems necessary to meet these needs. Our GPCM system is updated quarterly to capture the latest data on infrastructure, tariffs, supply and demand components, and all facets impacting optimization of the North American natural gas market. GPCM provides analysts with a robust modeling system to conduct base case and scenario analyses for almost any imaginable situation. Coupling GPCM with our G2M2® Global Gas Marketing Modeling System™, RBAC provides a robust base case database that not only gives a detailed view of the North American market, but also a comprehensive assessment of the interactions and impacts across the entire global gas and LNG arena. Likewise, GPCM can be integrated with a power market model such as Aurora or PROMOD using RBAC’s Power Model Interface (GPCM-PMI™). This integration further enhances the analyst’s forecasting capability by creating a more realistic gas and power market forecast that considers the impact the gas market has on the power market and vice versa.
RBAC provides the energy industry with state-of-the-art modeling systems to improve analytical capabilities and optimize decision making, in pursuit of our goal to help our clients enhance stakeholder value while increasing the availability of affordable energy throughout the world.