The Energy Information Administration (EIA) published their 2026 Annual Energy Outlook (AEO) on April 8, 2026. This report, which “explores medium- and long-term alternative futures in the United States” for energy supplies, is published in the spring of each year. It is reviewed by analysts, government officials, utility operators, and industry members nationwide.
RBAC closely vets the AEO; in fact, RBAC previously used AEO data to construct its U.S. natural gas electric generation outlooks. While we shifted to an alternate methodology, the AEO report remains important context in our analysis. Below we share some of our thoughts regarding the recent publication, and how it compares to our own perspectives on future natural gas-fired electric generation.
Probably the most notable shift in 2026 is that the future of natural gas in the power mix looks materially different from what the AEO forecasted just a year ago, largely due to a combination of stronger electricity demand, updated assumptions around renewable incentives, and continued retirements of coal-fired generation. This has produced a power outlook in which gas has a much larger future share than previous reports.
Consumption for Electric Generation
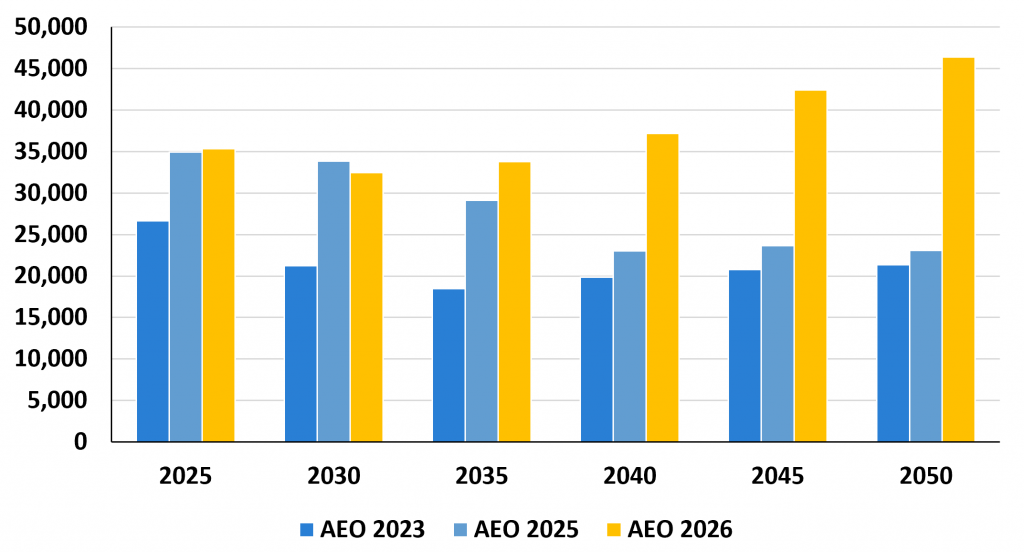
Compared to the projections from the 2023 and 2025 AEO Reference cases, the 2026 AEO Counterfactual case – representing baseline assumptions regarding how U.S. and world energy markets would operate through 2050 under laws and regulations in force as of December 2025 – , projects substantial growth in natural gas consumption for electric generation from 2030 to 2050. Consumption declines from 35.3 Bcf/d in 2025 to 32.3 Bcf/d in 2027 and remains between 31.0 – 32.0 Bcf/d up until 2030. Following that slight decline, natural gas consumption grows until 2050, increasing from 32.5 Bcf/d in 2030 to 46.4 Bcf/d in 2050, an increase of 43%, or a 1.7% CAGR.
The 2026 AEO projection for natural gas consumption for electric generation in 2050 is over double the values projected in the 2023 and the 2025 AEO Reference cases. The increase is driven by changes in assumptions to the penetration/longevity of renewable tax credit, along with a general increase in electric generation demand projections. The 2026 AEO projects U.S. total electric generation will increase by 30% from 2025 to 2050 (from 4,248.5 TWh to 5,781.8 TWh). In this sense, the projections for natural gas use are more aligned with market fundamentals (e.g., large load demand, increasing summer cooling needs, etc.) that are becoming more visible in energy markets.
Share of Electric Generation
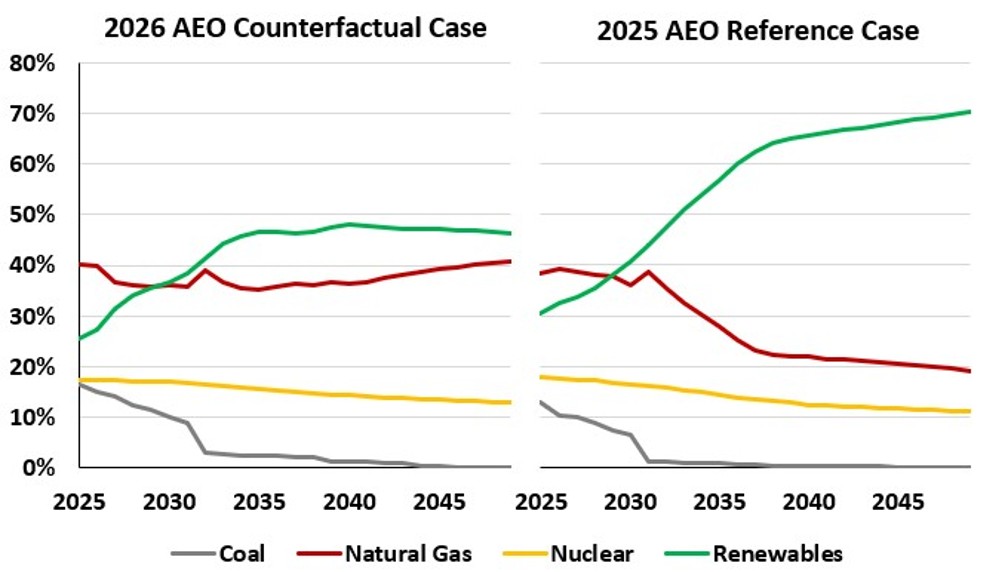
While the absolute values of natural gas consumption for electric generation are greater than in prior AEO outlooks, the share of natural gas in total electric generation remains relatively flat over the projection period. Gas-fired generation’s share of total generation remains between 36 – 41% from 2025 to 2050, compared to the decline to 19% in the 2025 Reference Case.
The temporary decline in consumption in 2026 is due to the continuation of IRA renewable tax credits and coincides with an increase in renewable use for electric generation. The increase in the mid-2030s is driven by the broad increase in electric generation demand – due to data centers and commercial computing power – as well as a decrease in coal-fired electric generation during this period.
Natural gas’s projected share of electric generation reflects key power market fundamentals: strong load growth, rising renewable penetration, and long-term coal retirements. The relatively steady share of gas in the energy mix reflects its role as a highly dispatchable supply, increasing during times of peak load and meeting electricity demand during periods of reduced renewable generation.
Alternative Cases
The AEO, as in prior years, published several “alternative” or “side cases” that display how projections differ when the Counterfactual case assumptions are altered.
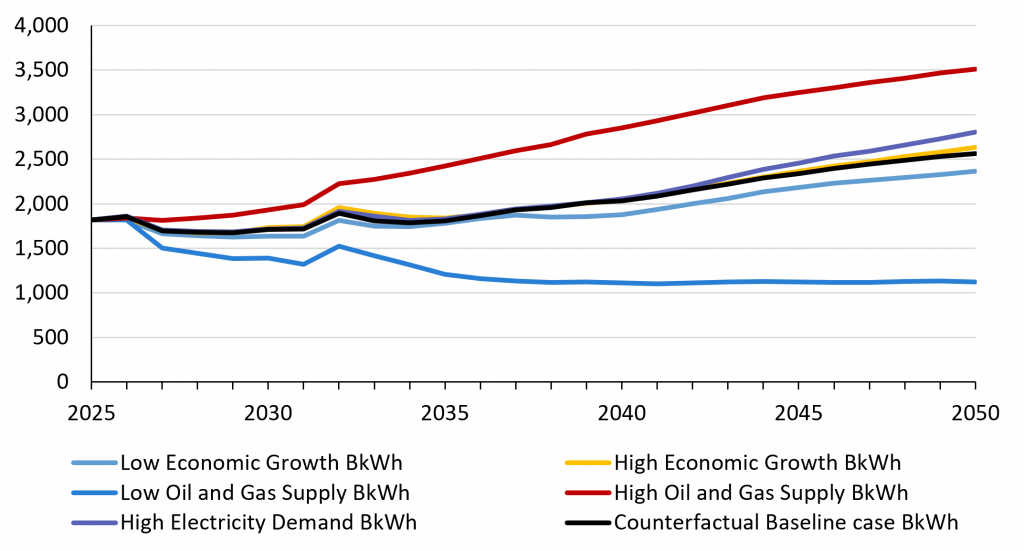
The most substantial change in natural gas consumption for electric generation between side cases comes from the High Oil and Gas Supply case. Like the 2025 AEO, this case assumes 50% greater natural gas production and technological improvement rates over the Counterfactual case. Natural gas consumption for electric generation increases by 93% from 2025 to 2050, v. the 41% in the Counterfactual case. Although the High Oil and Gas Supply case projects the largest increase in natural gas consumption for electric generation (more than 17 Bcf/d above the current estimates!) the case is based on assumptions that represent a substantial shift from the current geological assumptions in the Counterfactual case, which already includes robust natural gas production and consumption .
Another interesting alternative case is the High Electricity case, designed to test the impacts of high electric demand driven by data centers on U.S. energy outlooks. The case assumes that
- the installed stock of AI servers increases at an exponential rate through 2050,
- and that this demand and data centers are generally more energy intensive than expected, with no additional increases in efficiency.
This case projects that natural gas fired power generation reaches 2,805.1 TWh by 2050, v. the 2,563.2 TWh in the Counterfactual case, which RBAC estimates to be ~ 4.0 more Bcf/d of natural gas consumption for demand by 2050. While the assumption changes represent significant growth in natural gas-fired power generation, the results are dwarfed by those from the High Oil and Gas Supply case. The reasonably modest differences are also due to changes in the electric demand growth assumptions made in the Counterfactual case, which increased electric demand levels significantly above the 2025 projections, “baking in” some of the increases (see Figure 1). Combined with higher renewable generation assumptions, the difference between the two cases is not as dramatic as it could be.
Comparison to the 2026 Q1 Base case
The 2026 AEO and the 2026 Q1 GPCM Base Case forecast roughly similar natural gas consumption values for 2050. While the 26Q1 Base case forecasts a gradual increase in natural gas-fired power generation demand, leveling off around 2045, the 2026 AEO projects relatively stable demand through about 2030 and then a substantial increase in consumption. The 2026 AEO projection crosses over the 26Q1 Base case in 2046 as the AEO projects continued consumption increases.
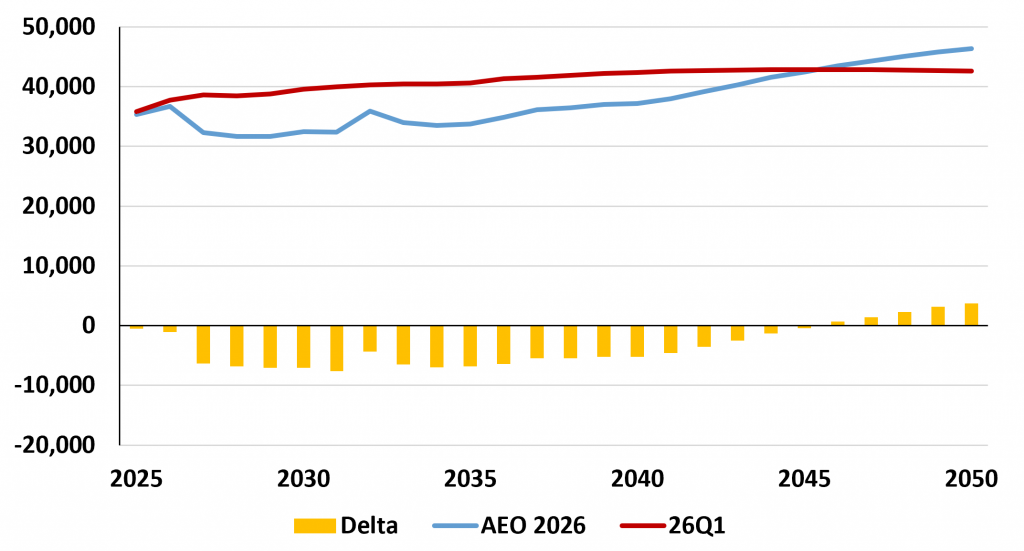
However, compared to the 2025 Reference Case, the 2026 Counterfactual case projections are more aligned with other forecasts for natural gas demand (such as the 2025 NERC forecast, which serves as the basis for RBAC’s electric outlook assumptions).
Discussion
Like prior publications, the AEO only includes publications as of December of the prior year (e.g., the 2026 AEO includes policy assumptions as of December 2025) to allow model documentation, analysis, and review processes. In the 2025 AEO, this caused projections to include some Biden-era policies that had been rolled back by the time of publishing; in this case, the AEO does not consider the ongoing conflicts in the Middle East and how that may impact natural gas and energy more broadly. To EIA’s credit, the AEO includes alternative cases that test what could happen if major federal power-sector and transportation emissions rules were removed, which also show how much the outlook depends on policy assumptions, not just market fundamentals.
Additionally, a recurring theme is the variability in electric generation demand estimates. AEO cases presenting ranges for natural gas anywhere between 38.1 Bcf/d and 50.4 Bcf/d by 2050. However, it’s worth noting that natural gas consumption increases in all but one of the alternative cases (the Low Oil and Gas Supply Case). We at RBAC continue to maintain a reasonably conservative stance, which places natural gas consumption for electric generation at ~ 43 Bcf/d due to several factors that will temper demand, including:
- Delays in natural gas turbine development and deployment,
- Probable double counting of data centers in electric generation estimates in provider forecasts,
- Growing backlash at the community level to data centers and their perceived impacts on affordability, and
- Competing demand from LNG for molecules.
Final Word
Taken together, the 2026 AEO raises a practical question: how much gas-fired electric generation demand grows, where it grows, and how load growth, generation additions, and regional constraints shape that future.
However, you don’t have to take our word for it! Using GPCM, a user can model any or all these alternative projections, with their own customizable set of assumptions for supply, demand, prices and flows across North America. For example, you could model what happens if infrastructure doesn’t expand to meet natural gas demand (an assumption made throughout the AEO cases) with toggling our “Auto-expand” feature, or model gas flows to electric customers in Texas as data center demand increases.
RBAC, Inc. has been the leading provider of market fundamental analysis tools used by the energy industry and related government agencies for over two decades. The GPCM® Market Simulator for North American Gas and LNG™ is the most widely used natural gas market modeling system in North America. RBAC’s G2M2® Market Simulator for Global Gas and LNG™ has been instrumental in understanding evolving global gas and LNG dynamics and is vital in fully understanding the interrelationship between the North American and global gas markets.