

Winter is coming along with natural gas demand. Coupled with LNG exports and the new kid on the block, AI / data centers, that’s a lot of demand.
But the United States has a lot of natural gas. U.S. dry gas production is expected to average approximately 112.5 Bcf/d this winter, up around 2.5 Bcf/d from last year. Supply growth is actually expected to outpace demand growth, even with LNG exports continuing to rise.
So, problem solved, right? We have plenty of gas.
Everything Everywhere All At Once
It’s not like one giant milkshake and everyone has a straw.
Or might think more like a gasoline pump. That’s a bit closer. Except almost anyone can grab the nozzle and try and get the gas. Except that gas isn’t at the local station. It’s coming through a complex network of pipes from Marcellus, Haynesville, Midland, the Delaware Basin or elsewhere.
But even a straw has a maximum capacity.
And therein lies “the rub.” That’s the difficulty.
We need more straws, more fuel hoses, more natural gas pipelines.
National statistics show ample supply, but natural gas recently traded for less than $1/MMBtu at some Appalachian locations. Earlier this year, prices in the Permian Basin went negative – producers were actually paying somebody to take their gas.
So, with LNG exports and data centers mushrooming the country, why are prices so low?
They aren’t — not everywhere. Travel the country and find anything from $0.89 – $3.69 spot (October 9, 2026).
So, if the prices could settle out, that would be wonderful. It’s like finding only cappuccinos for $6 locally when a few miles away they were $2. But if a river was in between and there was no easy way to cross, then partakers either get their caffeine fix for $6 or substitute tea or barely tolerable instant coffee or do without entirely (called here substitution and demand destruction respectively).
No, natural gas has to move through a physical network of pipelines, storage facilities, compressor stations and interconnects. And increasingly, it has to find its way toward a growing collection of LNG facilities, power plants and potentially enormous new data-center loads.
So, having the gas is one thing, but getting it where it needs to go is another.
Pressure in the Permian
The Permian Has Been Telling Us This for a While
Back in August, we looked at precisely this problem in Can New Pipeline Capacity Keep Up with Permian Production?
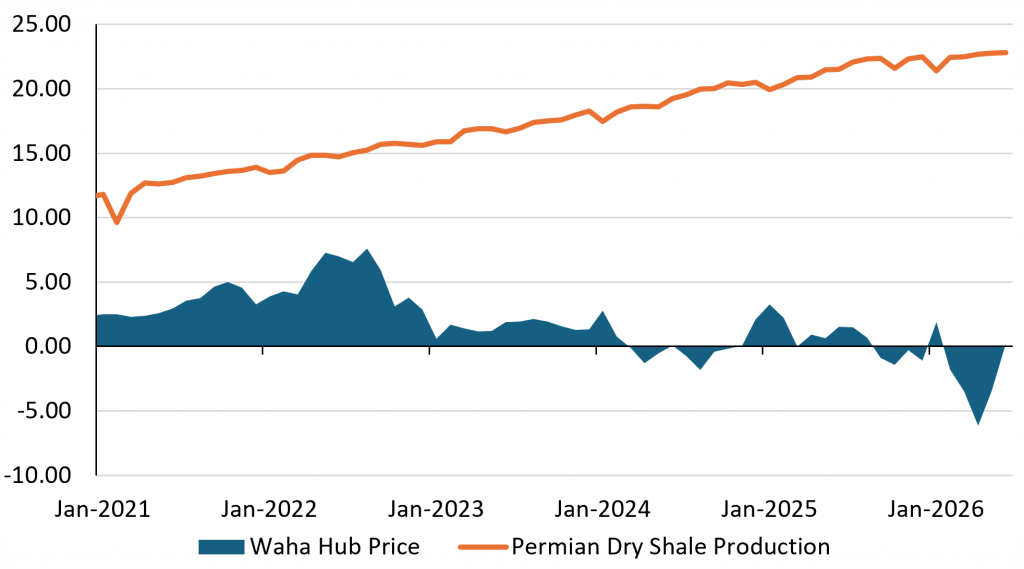
Permian natural gas production had risen from only about 2.1 Bcf/d in January 2016 to nearly 23 Bcf/d by May 2026. Because so much of that gas is associated gas (produced along with oil) when the price of oil is high enough, producers can make a profit even with a negative price for the gas as long as there’s enough oil pipeline capacity to move it to downstream markets. But what if there’s not enough gas pipeline capacity? Then producers will pay pipeline companies to take the gas away usually from the Waha system where gas is collected from several upstream producing locations.
Such constraints helped generate 172 days of negative Waha prices in 2024, 105 in 2025, and another 158 days through June 1 of this yea (2026). This situation created an opportunity for more export capacity from Waha. And in fact more pipe capacity came.
Gulf Coast Express expansion, Hugh Brinson and Blackcomb, together were expected to provide approximately 4.5 Bcf/d of additional Permian takeaway capacity during 2026. Using GPCM® Market Simulator for North American Gas and LNG™, we examined how quickly they could fill, where their supply would come from, where the gas would go and how other pipelines would respond.
Then the Room Got More Crowded
Only a couple of weeks later, WhiteWater Midstream and its partners announced FID on the Solitude Pipeline System, consisting of two 48-inch pipelines capable of moving another 4.5 Bcf/d from the Permian to the Katy area.
So, we followed August’s article with Solitude in a Crowded Room, examining what happens if you introduce all that additional egress (with other factors kept constant). I tell you, you can do some really interesting things with GPCM.
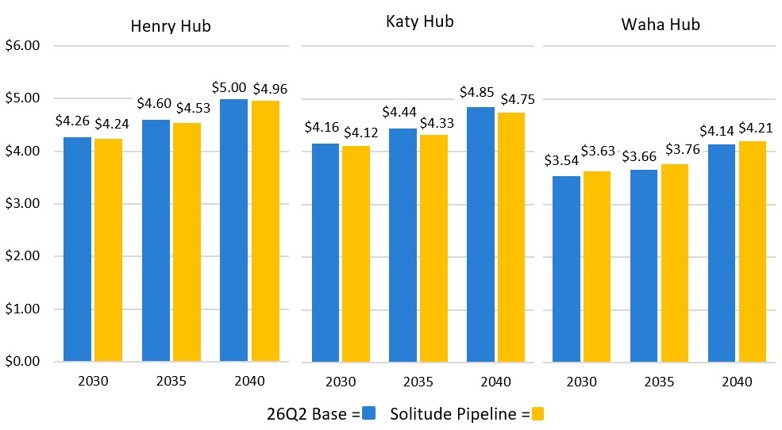
In the scenario, increased egress gradually raised Waha prices by roughly $0.10/MMBtu relative to the Base Case and narrowed basis to Henry Hub and Katy. That extra Permian supply put downward pressure on prices farther east. In this scenario, already operating pipes such as ONEOK, Whistler, Hugh Brinson, Permian Highway and Enterprise lost some flow as gas redistributed across the network.
Adding pipeline capacity didn’t simply change the basis at Waha, it changed prices and flows across the entire region.
Appalachian Basin: Resource Abundance, Pipelines Scarcity
In the northeast, the Appalachia has a similar egress problem to the Permian, but for different reasons. It produces non-associated gas, it is fundamentally a natural-gas basin — and a huge one at that.
The EIA reported that Appalachia produced 36.6 Bcf/d of marketed natural gas in 2025, more than any other U.S. producing region and about 31% of total U.S. marketed gas production. Yet production growth has been slowed for the same reason: limited pipeline takeaway capacity.
With current production running around 35.5 Bcf/d and local consumption about 10 Bcf/d, roughly 25.5 Bcf/d has to find its way out every day. That makes pipeline capacity an enormous factor in regional prices and basis.
On October 8, Marcellus/Utica spot gas was reported at only $0.885/MMBtu, compared with $3.155 at Henry Hub — a $2.27 discount.
Natural gas production is clearly not the problem. But can the gas move from where it is produced to where it is wanted?
Perhaps it is rhetorical, but “would more pipeline help?”
Let’s look to some recent examples: Mountain Valley Pipeline (MVP), which finally entered service in June 2024 after years of delays. MVP added the ability to move up to 2.0 Bcf/d of Appalachian gas from West Virginia to an interconnection with Transco in Virginia. While further north, also in 2024, Transco’s Regional Energy Access expansion, added a little over 0.8 Bcf/d toward Pennsylvania and New Jersey markets.
And what happened? Appalachian production grew by only about 46 MMcf/d in 2024, but after MVP entered service and with stronger Henry Hub prices, production grew another 1.1 Bcf/d (1100 MMcf/d) in 2025.
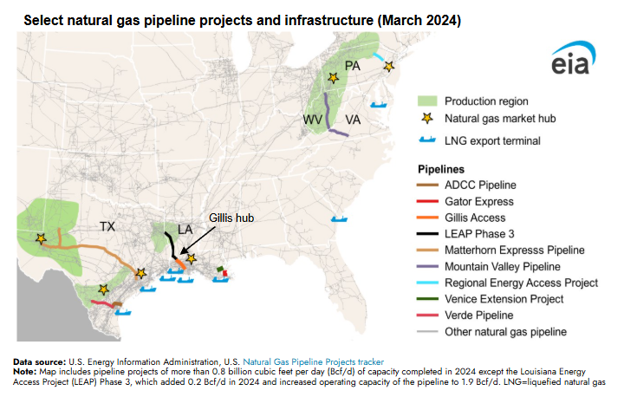
But even MVP did not make the problem disappear. Downstream constraints on Transco have kept the 2 Bcf/d pipeline from being able to flow at full capacity. But more pipe is coming: Transco’s Southeast Supply Enhancement is expected to add about 1.6 Bcf/d of capacity, relieving a bottleneck and allowing more Appalachian gas to move toward southeastern markets, completion targeted for 2027. Transco’s Northeast Supply Enhancement adds another roughly 0.4 Bcf/d, improving deliverability toward New York and New Jersey.
Elsewhere, TC Energy announced an Appalachia Supply Project designed to provide 0.8 Bcf/d of additional capacity for new natural-gas-fired power generation beginning around 2030, with the potential to expand up to 2 Bcf/d, with regional electrification, economic development and data centers as drivers of longer-term load growth.
So solving both sides of the equation at once, we find we have both more ways for gas to leave the basin, and more demand showing up closer to home.
Speaking of demand…
Demand-side Pressure
Data Centers are Major Drivers
Electricity demand is rising again after years of relatively little growth, with data centers one of the major drivers. EIA now expects U.S. electricity use to set records in both 2026 and 2027.
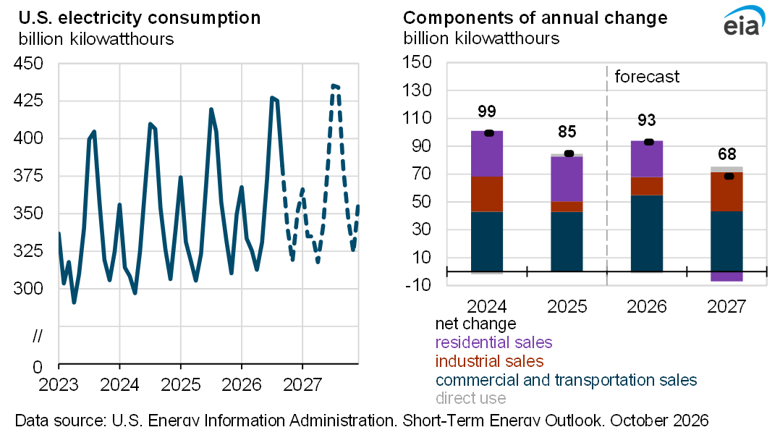
That power demand could add even more pressure over the longer term. As RBAC noted in Evaluating 2026 AEO Natural Gas and Power Demand, the 2026 AEO projects natural gas consumption for electric generation dipping from 35.3 Bcf/d in 2025 to 32.3 Bcf/d in 2027, then climbing from 32.5 Bcf/d in 2030 to 46.4 Bcf/d by 2050 (43% increase). Evaluating year-to-date through July, EIA reported 2026 actually increased gas-for-power demand by approximately 0.9 Bcf/d versus 2025. So, even in the near term, we are seeing additional pressure in this sector.
And geography is especially relevant here. EIA specifically points to new data centers and large industrial loads in Texas and Virginia as drivers of higher power demand, with summer gas burn for power forecast to reach a record 46.1 Bcf/d in 2027. In EIA’s higher-demand scenario, gas-fired generation growth from 2025–2027 increases from just 1.7% in the baseline to 7.3% under the higher-demand case.
RBAC did a study of “Data Center Alley” in Virginia, showing how market impacts could be evaluated in Forecasting the Surge: Virginia Data Centers, Natural Gas, and the Power Demand Puzzle: “The power leveraged in GPCM is that it allowed us to change one thing – natural gas fired electric generation demand in Virginia – and see the impacts on many different factors (production, flows, price, consumption); invaluable intelligence to make informed market decisions.”
LNG Is an Even Bigger Pull on U.S. Supply
U.S. LNG exports averaged 17.4 Bcf/d during the first half of 2026, up 23% from the same period in 2025. Plaquemines LNG has reached full capacity, Corpus Christi Stage 3 has been ramping up its seven new trains, and Golden Pass shipped its first cargo this April. Together, Plaquemines and Corpus Christi Stage 3 add about 4 Bcf/d of nominal export capacity, while Golden Pass is adding 0.7 Bcf/d more.
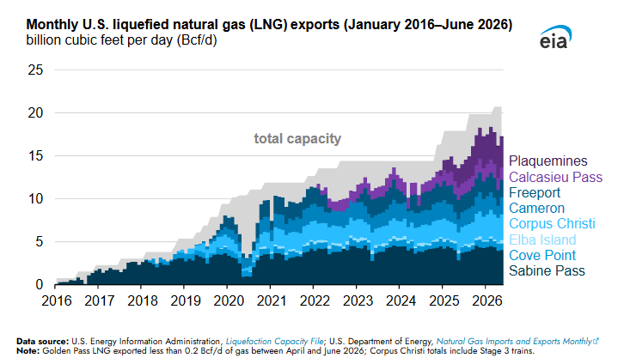
And more is coming next year. EIA expects Port Arthur LNG Phase 1, Rio Grande LNG Trains 1 and 2, and the remaining Golden Pass capacity to add to LNG exports in 2027.
That’s more gas ultimately needing to mend its way to the Gulf Coast.
There’s Plenty of Gas — If You Can Get It
The Permian can produce so much gas that producers will pay somebody to take it, while elsewhere you can’t pay less than $3 per MMBtu. Appalachia can produce 35 Bcf/d and still see prices collapse with pipeline maintenance or takeaway capacity tightens.
It’s most interesting that the equation isn’t so linear to just add another pipeline to solve it. RBAC’s expert modeling and real-world experience will demonstrate how new pipelines will change gas routes, flow rates in competing pipelines, prices at other hubs and even cause producers to respond by producing still more.
Meanwhile, the demand side keeps changing too.
LNG facilities along the Gulf Coast continue to be built and continue to pull increasing volumes toward export markets. Electricity demand is growing again. AI and data centers are adding large loads in places such as Texas and Virginia. Some of that demand even has the potential to develop close enough to obviate building a major new pipeline.
An onlooker to this huge data center buildout may have asked, “why so much natural gas?” I think the supply outlook above answers that question. There is plenty of gas underneath North America. So, the more important question is can we connect supply to the demand?
And when we do, that new pipeline in Permian can affect prices hundreds of miles away. More Appalachian takeaway can change flows into the Southeast. New LNG trains on the Gulf Coast will pull more gas through the vast chain of pipelines reaching back toward producing basins. A few gigawatts of new power demand can change flows and prices.
How can you truly understand all the changes when it seems like they involve everything, everywhere, all at once? To do this, you need GPCM.
Interested in scheduling a demonstration of GPCM? Contact RBAC today!
RBAC, Inc. has been the leading provider of market fundamental analysis tools used by the energy industry and related government agencies for over two decades. The GPCM® Market Simulator for North American Gas and LNG™ is the most widely used natural gas market modeling system in North America. RBAC’s G2M2® Market Simulator for Global Gas and LNG™ has been instrumental in understanding evolving global gas and LNG dynamics and is vital in fully understanding the interrelationship between the North American and global gas markets.