

Solitude in a Crowded Room
They say three is a crowd, and West Texas just got more crowded. RBAC recently wrote about the abundance of new pipeline egress under development in the West Texas Permian Basin. In our recent article “Can New Pipeline Capacity Keep Up with Permian Production?,” published on August 4th, we provided a detailed analysis of the three projects; the Gulf Coast Express expansion, the Hugh Brinson pipeline, and the Blackcomb pipeline, all of which have or will come online by the end of 2026. Then less than two weeks later, we, along with many others in the natural gas industry, were blindsided by the announcement of the Solitude pipeline.
Figure 1: Solitude Pipeline, proposed route (2026)
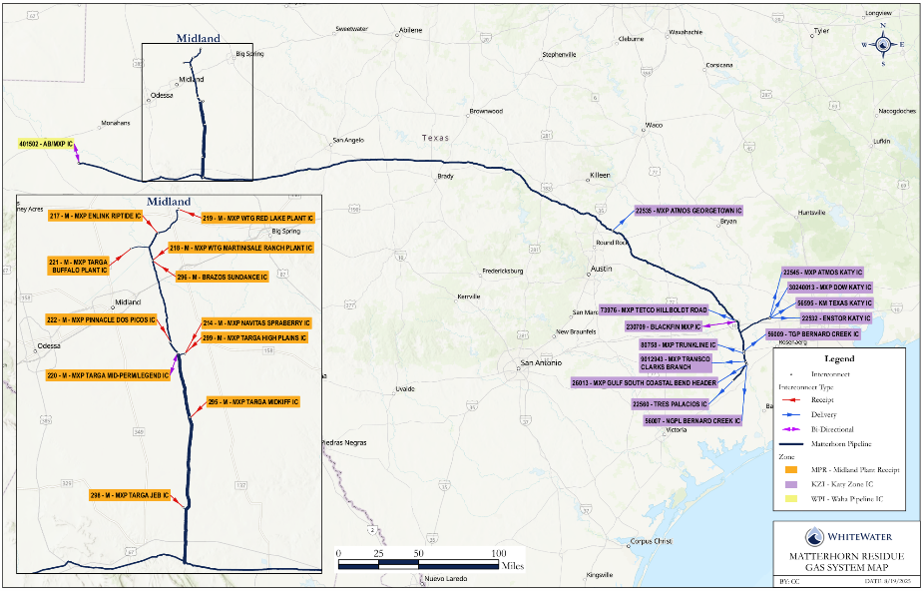
On August 17th, 2026, WhiteWater midstream, along with four other companies, announced a Final Investment Decision (FID) on their Solitude Pipeline System joint venture. The project consists of two 48” pipelines, each with the capability to transport up to 2.25 Bcf/d (total of 4.5 Bcf/d) of Permian natural gas to the Katy Hub in east Texas. The pipeline is expected to be partly in-service by 2029, with the first phase completed by that year and the second phase expected by 2030.
Naturally, we were curious to see the impacts of this new, 4.5 Bcf/d pipeline on gas market fundamentals, especially considering our prior article. Using RBAC’s GPCM model, we did precisely that, modeling the addition of the Solitude pipeline on the fundamentals reflected in our 26Q2 Base Case forecast. We completed our analysis just in time for our most recent User Conference, held this year in Denver from September 9-11, and presented our findings there. This article is based on the results discussed from that presentation and provides a taste of some of the topics discussed at this year’s conference.
Scenario Set Up:
To model the Solitude pipeline, we first created a new scenario in GPCM. From there, we added the Solitude Pipeline to our 26Q2 Base Case, including the two-phased start-up of the pipeline’s capacity, its supply linkages, and interconnects to other pipelines. Where data wasn’t available, RBAC used data consistent with the Matterhorn pipeline, which many analysts believe Solitude’s route will mimic, along with other characteristics. We then ran a scenario from 2018 to 2040, to examine how the pipeline addition would impact prices and flows
Price Impacts:
Figure 2: Basis Comparison, Selected Hubs, 26Q2 Base and Solitude Pipeline Scenario, 2030-2040 ($/MMBtu).
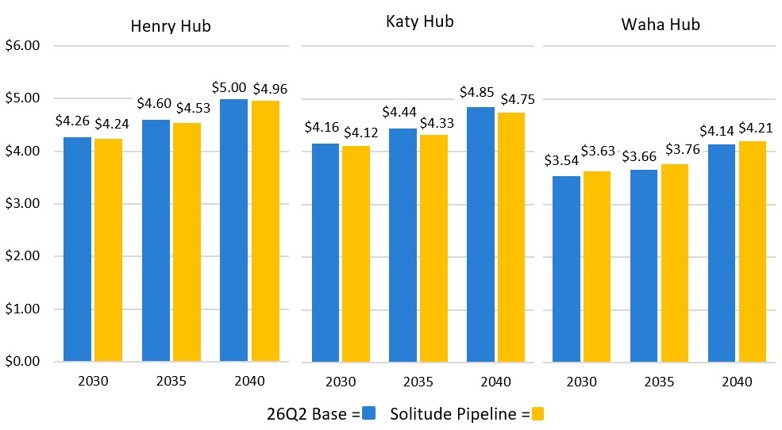
When analyzing increased egress from the Permian Basin, our expected outcome was that basis between the western and eastern portions of Texas would narrow, either by an increase in prices in the western part of the state, a decrease of prices in the eastern, or some combination of the two. We see these precise outcomes occurring in our Solitude scenario whereby Waha Hub basis to Henry Hub decreases by $0.11, and by $0.17 to Katy Hub by 2040.
In terms of price increases, prices at our Waha Hub pricing point gradually rise from 2030 through 2040, with the prices in the Solitude scenario consistently ~$0.10 above our 26Q2 Base Case. With no additional supply dispatched (we kept our supply and demand assumptions the same between scenarios), the increased egress capacity allows for more gas to reach a premium priced market, thus causing the price increase. Additionally, prices in Eastern Texas (here, demonstrated by Henry Hub and Katy Hub) decreased compared to the Base Case by a similar quantity; when keeping demand constant between scenarios, the increased egress capacity brought more gas to these eastern hubs, increasing supply and thereby lowering prices in those areas.
Flow Impacts:
Figure 3: Change in Supply Deliveries from Permian Basin, Select Pipelines, 2035 (MMcf/d)
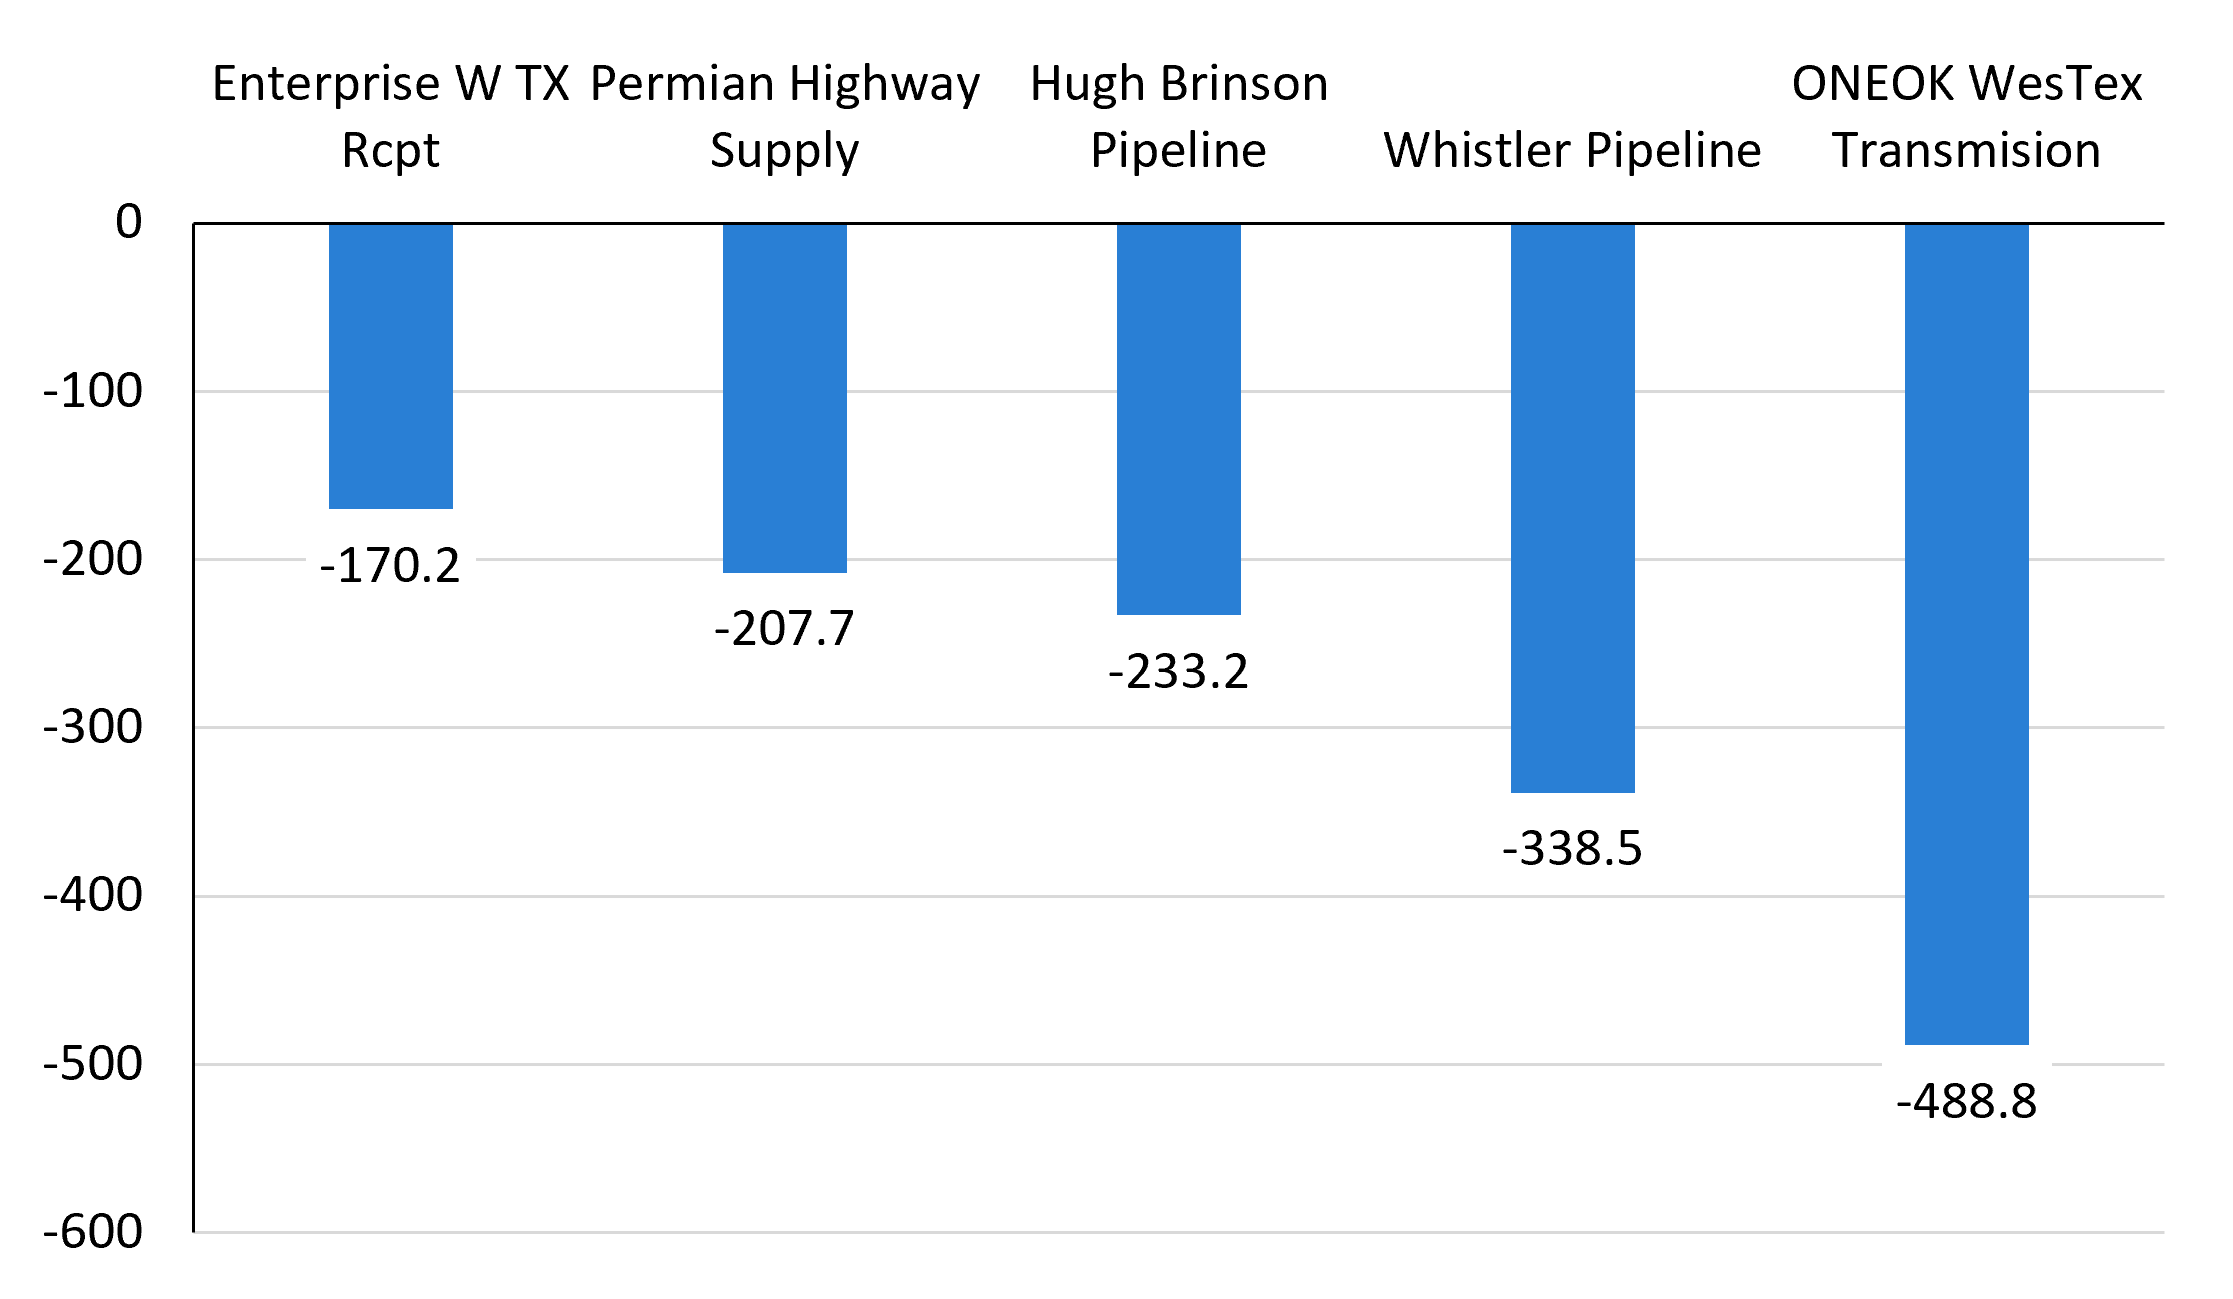
Using the GPCM®’s Pipeline Use Summary Report, we compared flows between all the pipelines that take supply from the Permian basin modeled in GPCM® between the Base Case and Solitude scenario. Comparing results, shown in Figure 3, we see a decrease in flows on many pipelines, with the largest reductions being on ONEOK (0.5 Bcf/d reduction), Whistler (0.4 Bcf/d), and Hugh Brinson, Permian Highway, and Enterprise pipelines (all ~0.2 Bcf/d reductions).
The results here follow what theory would suggest. Given that supply and demand were held constant between scenarios, the only variable altered was the introduction of the new egress capacity from the basin. As such, existing pipelines in the area see a decrease in flows once the Solitude pipeline is brought online, as takeaway capacity rises relative to supply. The introduction of an additional 4.5 Bcf/d of capacity is distributed among the existing players in the basin, causing broad, but generally slight, reductions in utilizations and flows from the impacted supply areas.
Conclusion
The analysis we conducted demonstrates the responsiveness of Permian, Henry Hub, and other areas’ prices to changes in pipeline capacity. In addition, it also shows the impact of new capacity on flows when holding other fundamentals (supply and demand) constant.
With the recent open season for Enbridge’s West Texas Express, the Permian region is only getting more crowded. A greenfield intrastate project designed to take an additional 2.0 Bcf/d of gas from the Waha Hub Permian westward to El Paso, Enbridge is joining the crowd in competing for Permian molecules. One thing is certain. This crowd is quickly escalating into the biggest stampede seen outside Calgary.
However, as with many analyses, we were left with even more questions than beforehand. Will the investor mix of the Solitude Project (consisting of several prominent Permian oil producers) impact associated gas flows to other pipelines in the region beyond what is economically dispatched? What would happen to flows if or when Permian supply increases above our forecast? Or what about a change to oil fundamentals – an increase in the Gas to Oil Ratio (GOR) or a prolonged elevation in oil prices? Will there be future project announcements to facilitate the flow of gas from Katy to LNG Projects on the Gulf Coast? What does this mean for the Haynesville supply outlook?
RBAC’s Rob Kachmar noted during the User Conference, “As more and more egress capacity comes online and strengthens the pricing fundamentals in the region, it’s possible that gas stops being an afterthought and takes center stage.” So, a final question: if Permian gas supply becomes more important to producers, how would additional supply, and at what price, alter these results?
Luckily for us, we can use GPCM to answer all (and more) of these questions…
Interested in scheduling a demonstration of GPCM? Contact RBAC today!
RBAC, Inc. has been the leading provider of market fundamental analysis tools used by the energy industry and related government agencies for over two decades. The GPCM® Market Simulator for North American Gas and LNG™ is the most widely used natural gas market modeling system in North America. RBAC’s G2M2® Market Simulator for Global Gas and LNG™ helps users understand evolving global gas and LNG dynamics and the interrelationship between North American and global gas markets.