
How Traders (and Others) Could Use GPCM
Use Case: Getting Natural Gas into New England during Winter
The “Edge” of Tomorrow in Natural Gas
Sometimes the most important thing a natural gas trader (or other market participant) can know is not where the price is going tomorrow, but where the system is vulnerable.
The winter of 2013–2014 in New England provides a good example.
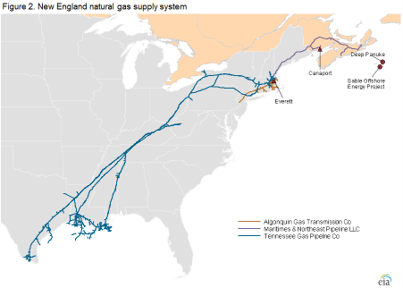
New England had plenty of natural gas relatively close by. Production from the Marcellus Shale was growing rapidly just a few hundred miles away.
But there was a looming problem. That plentiful supply could flow easily to New England in early and mid-Autumn. But if the weather got very cold and heating demand rocketed, getting enough gas, fast enough, into New England on a very cold winter day was another matter entirely.
Natural gas had to travel through a limited number of pipelines into a region where homes, businesses and increasingly power plants, were all competing for supply. If temperatures plummeted, those pipelines could become effectively full.
And if that happened, local natural gas prices could separate dramatically from the rest of the country.
That is exactly the sort of physical market problem where a model such as GPCM (a fundamentals-based natural gas market model) can help an organization anticipate constraints, evaluate exposure and prepare for periods of system stress.
But winter was approaching, and the market was already pricing in physical delivery risks. Heading into late autumn, forward curves showed a substantial premium for January 2014, with the Algonquin Citygate forward basis (the expected price difference between gas delivered at Algonquin and Henry Hub) reaching about $17.41/MMBtu.
The pressure was not just appearing in financial markets. It soon reached the physical market as well. And that distinction is useful.
Months before winter, a trader (or gas marketer or other market participant) can use Henry Hub futures or forwards to manage broader natural gas price risk, and regional basis contracts to manage the price difference between Henry Hub and Algonquin Citygate.
Futures are standardized exchange-traded contracts, such as NYMEX Henry Hub futures. They are commonly used to hedge or speculate on the benchmark gas price.
Forwards are privately negotiated contracts between two parties for a future period or delivery point. They can be tailored more specifically than exchange-traded futures.
Basis contracts focus on the difference between a regional gas price and Henry Hub. For example, a New England participant may care not only about whether Henry Hub rises, but whether Algonquin becomes much more expensive relative to Henry Hub.
In late November 2013, December bidweek (end-of-month contracting for next month’s gas deliveries) at Algonquin Citygate averaged $14.52/MMBtu. Cold weather, forecasts for more cold in early December, and scheduled maintenance at the Deep Panuke offshore gas project all contributed to the jump.
So imagine a utility, marketer, or trader that had recognized the winter risk months earlier. It might already have secured some of its physical supply through earlier contracts, storage, or transportation arrangements, while also using financial contracts to hedge part of its price exposure. Participants needing to secure more of their December supply during bidweek could suddenly find that gas in New England was extraordinarily expensive.
This is where the financial and physical sides of gas trading meet. A futures position on Henry Hub gas does not magically turn into gas delivered to New England. Most futures positions are settled financially before delivery, while the physical gas still has to be purchased and transported separately. If prices rise, gains on the hedge can help offset the higher cost of securing that physical gas during bidweek or through other physical market transactions. A regional basis position can more specifically protect against the widening difference between New England prices and Henry Hub.
And that creates another possible opportunity for traders. If their analysis suggests the future regional price difference is too small relative to the physical risk they see in GPCM, they may be able to take a position before that difference widens. In simple terms, they are comparing what the market is pricing with what they think the physical system can actually deliver.
The pipeline bottleneck was no secret, but the more useful question for the analyst was:
Did market prices adequately reflect the full physical risk under a severe cold scenario, and then were supply, transportation, and risk-management strategies prepared for it?
Putting the Physical Market Into GPCM
That is where the analyst could begin testing for system constraints.
Start with a base case (a reference case) representing expected market conditions and normal or expected weather.
GPCM represents the production, demand, pipelines, pipeline capacities, interconnections, storage and prices of the North American gas market. It can produce regional prices and basis along with pipeline flows and utilization. Severe- and mild-winter cases are specifically among the scenarios that can be modeled.
So, now change one assumption:
Winter will be colder.
That increases residential and commercial heating demand.
Then look at what happens.
- How much more gas tries to enter New England?
- Which pipelines become heavily utilized?
- Does available storage help?
- Where do constraints appear?
- And what happens to the price difference between New England and Henry Hub?
The point is not simply to produce a higher price forecast, rather the analyst is trying to understand the mechanism behind the change in price.
Suppose the model shows that under average weather in the base case, New England has enough supply; but under a significantly colder case, the pipelines feeding the region approach their limits. Additional demand can no longer be met simply by bringing another increment of inexpensive gas from somewhere else.
Now the local market begins behaving differently.
That is information market participants can use to secure supply, evaluate transportation needs, manage exposure and make better-informed commercial decisions before the system is under stress.
How Market Participants Can Respond
The trader not only knows that
“New England winter gas will probably be more expensive than usual,”
but more specifically, the model could show
“under normal winter weather the premium looks reasonable, but under severe cold the system becomes physically constrained and the price separation could become much larger.”
That is a deeper insight.
The trader can compare the modeled outcomes with the prices already available in the forward market. If the market appears to be pricing a relatively normal winter while the analyst believes there is a meaningful chance of a much colder one, the trading desk may decide the risk is underpriced.
How might that data be used?
Different market participants could respond in different ways. A physical gas trader or marketer might secure supply, arrange transportation or value pipeline capacity differently.
A gas supply manager might prepare for tighter operating conditions.
A commercial team might make sure the company can meet its existing supply and customer commitments at a manageable cost, while a basis trader might provide liquidity or place a trade on the basis between Algonquin Citygate and Henry Hub.
High forward prices and widening basis are not merely signals of potential trading profit.
They can also signal scarcity, encourage supply and transportation to be committed in advance, support risk transfer and reveal where the physical system may have difficulty meeting demand. They do not create additional pipeline capacity, but they help market participants recognize and respond to constraints before severe conditions arrive.
Then Winter Arrived
Cold weather began hitting the region in December 2013 and intensified in January.
During an early-January freeze, Algonquin Citygate reached $38.09/MMBtu as heating and power demand pushed the pipelines supplying New England to full utilization.
And that was not the end of it.
January 2014 became one of the coldest periods in recent Northeast history. On particularly cold days, Algonquin Citygate exceeded $75/MMBtu. The winter peak was a record $77.60/MMBtu.
For comparison, Henry Hub averaged only $4.63/MMBtu over the entire 2013–2014 winter. Even when the national market tightened substantially, Henry Hub’s daily spot price ultimately peaked at $8.15/MMBtu on February 10.
That enormous difference was largely about deliverability.
There was gas elsewhere, but the problem was getting enough of it through the available infrastructure to New England when everyone wanted it at once.
GPCM Doesn’t Need to Predict a Specific Price
This is an important point.
For GPCM to provide value, it would not have needed to say:
“Algonquin Citygate will reach $78/MMBtu on this particular January day.”
The useful signal could have appeared much earlier:
In a cold-winter scenario, demand reaches the limits of the pipeline system and New England becomes significantly more exposed than the national market.
That alone can change how a trader thinks about risk.
The analysis can be taken a step further. GPCM Daily is designed specifically to examine very cold or hot days, pipeline choke points, storage deliverability and the approximate direction and magnitude of resulting price impacts.
So there are really two possible time horizons.
Months before winter, an analyst can ask whether the region is structurally vulnerable under a colder-than-normal scenario.
Days before a major cold event, a more detailed peak-day analysis can ask where the system could become stressed if the weather forecast actually materializes.
Understanding Where the System Is Vulnerable
That may be the broader value of a physical market model: it helps participants understand where the system is vulnerable before severe conditions arrive.
Everybody can see the weather forecast or yesterday’s price. And once Algonquin is trading at $40 or $70, everybody and his uncle knows New England has a problem.
But did you really understand why the problem could develop before the price told everyone else the answer?
A fundamental analyst using GPCM could potentially show a trader (or others involved in the trades, a marketer, a commercial team, a gas supply manager, and so on) that the system works perfectly well under normal conditions but becomes severely constrained under another plausible set of assumptions.
The trader then has more than a gas forecast, they have a map of the risk.
And in natural gas markets, knowing where the system may run out of room can be more valuable than a stab at tomorrow’s prices.
And that can support trading, earlier preparation, more disciplined risk management and better-informed decisions about supply and transportation.
That is what it means when we say, “Let’s make better energy decisions.”
Interested in scheduling a demonstration of GPCM? Contact RBAC today!
RBAC, Inc. has been the leading provider of market fundamental analysis tools used by the energy industry and related government agencies for over two decades. The GPCM® Market Simulator for North American Gas and LNG™ is the most widely used natural gas market modeling system in North America. RBAC’s G2M2® Market Simulator for Global Gas and LNG™ helps users understand evolving global gas and LNG dynamics and the interrelationship between North American and global gas markets.