Proximity is the key ingredient in many facets of life — whom you marry, friends you make and keep, your first job — are just a few examples. But as the world becomes more interconnected through technology and advanced transportation networks, proximity’s reach has become nearly limitless. Comparably, the shale revolution and removal of the crude oil export ban, has led to a dramatic shift in energy commodity flows, reversing imports TO the U.S., to exports FROM the U.S. This has made the U.S. energy industry much more interconnected with global macroeconomic events. Until supply growth really moderates, the greater reliance on U.S. exports to clear excess supply means that prices for U.S. LPGs, crude oil, and natural gas will be largely at the mercy of demand growth in major consuming regions such as Asia and China in particular. It is becoming the case that when China sneezes, the U.S. energy industry catches a cold.
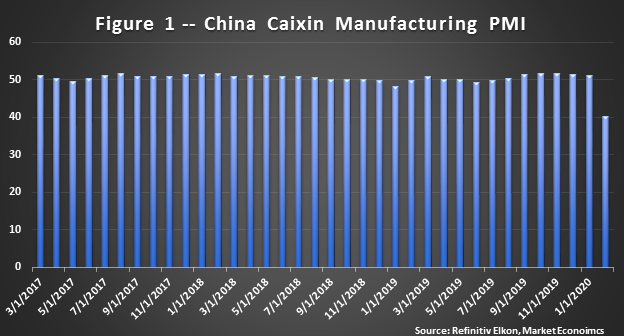
Not to make light of the coronavirus, officially known as the “Covid-19” virus, which is currently causing significant global health concerns, the yet-to-be declared pandemic has caused major disruptions to supply chains and global energy flows, not to mention huge drops in economic activity. As an example, look at China’s Feb20 Caixin Manufacturing PMI, a measure of manufacturing activity (where readings above 50 indicate growth and below 50 contraction), which registered an incredible drop to 40.3 from Jan20 levels of just over 51. With China’s 4Q19 GDP Year-on-Year (YoY) change notching a +6.1%, the latest PMI reading surely indicates things will be slowing down dramatically in 1Q20. Impacts on China’s gas demand are still being vetted, but some fascinating initial work by my colleagues Dr. Ning Lin and Birdy Chen can be found here with subsequent analysis forthcoming.
Bringing this back to the focus of this article, U.S. domestic natural gas, it is important to better understand what this manufacturing and potential global economic slowdown might mean for U.S. natural gas supply/demand balances and more specifically, what the impacts might be on Henry Hub gas prices. There have already been attempts at force majeure contract cancellations with 2 cargoes currently cancelled for Apr20 loadings — 1 from Cheniere’s Sabine Pass terminal and the other from their Corpus Christi terminal.1 Granted, this is only 2 out of 40 expected cargo loadings, but what might things look like should U.S. LNG exports trend lower throughout the balance of 2020?
Back on February 18, 2020, RBAC published the results of its 2019 Quarter 4 gas market outlook using the GPCM® Natural Gas Market Forecasting System™. This outlook was developed prior to the Covid-19 outbreak really taking hold and spreading globally, and certainly well before the most recent economic calamity onset. At that time, natural gas futures prices were hovering slightly higher than their current levels – around $1.86/MMBtu for the Mar20 contract, and currently, the Apr20 contract is trading roughly $1.90/MMBtu as this article is being written. As reported, RBAC expected prices to start increasing, climbing back over $2.00/MMBtu and continuing to trend higher through Jan21. The drivers were lower gas prices which would incentivize higher gas-fired power generation demand during the summer and LNG exports which were expected to remain robust, approaching 9 Bcf/d by Nov20. It was noted at that time that EIA had taken a more conservative view on gas-fired power generation demand for the next two summers – 2020 and 2021 – based on greater market penetration from renewable fuels-based power generation. So, in addition to testing the impacts of lower U.S. LNG exports, it’s also worth considering how prices will respond in a scenario where renewables compete more aggressively with natural gas.
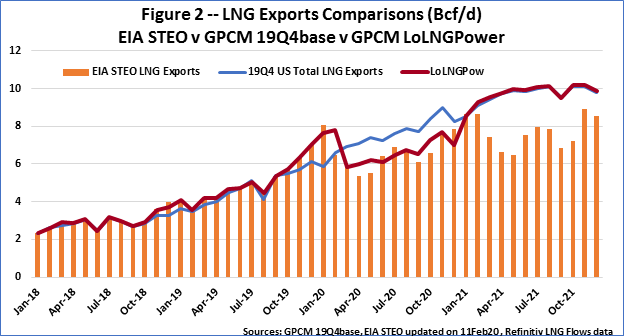
Constructing such a scenario in GPCM is very straightforward. For reduced U.S. LNG exports, it is assumed that exports will average approximately 15% lower than RBAC’s outlook due to Covid-19’s impact on slowing China’s economy and overall global macroeconomic disruptions. This scenario actually tracks much closer to EIA’s February 11, 2020 STEO forecast as shown in Figure 2 above. Also included are LNG vessel tracking flow data using Refinitv’s Eikon platform for Jan20 and Feb20 total monthly flows. This provides timelier information than what is available from the DOE and offers a more realistic evaluation of the Jan20 – Feb20 time frame. Furthermore, it is assumed that any impacts to U.S. LNG exports will only be realized in the 2020 time-horizon, thus by 2021 things are effectively “back to normal”. However, as my colleagues Dr. Lin and Birdy Chen’s research suggests, demand could rebound more quickly and vigorously should Covid-19 issues subside sooner, and pent-up demand materializes – another very easy scenario to construct, execute, and evaluate, so stay tuned…
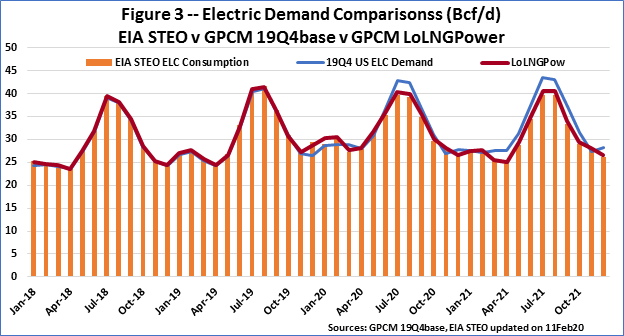
Next, to match EIA’s STEO lower gas-fired power generation demand, the outlook demand curves were modified by applying the ratio of the outlook’s forecast to EIA’s STEO forecast. The net result is roughly a 3% lower demand forecast vs RBAC’s outlook during the Apr20 – Oct20 summer/injection season and closer to 7% lower during the Apr21 – Oct21 season. This further demonstrates how easy it is to modify assumptions in GPCM, in this case to simulate EIA’s STEO, and test what-if scenarios that a user may or may not believe are high probability circumstances. Constructing such a portfolio of expected high and low probability assumptions, however, provides GPCM users with a more robust assessment of potential price outcomes as well as supply, demand and flow dynamics.
Since actual weather data is now available for both Jan20 and Feb20, downward adjustments have been made to U.S. residential and commercial demand as both months proved to be warmer than normal. These downward adjustments were based on U.S. population weighted heating degree days (PwHDDs) derived from the actual weather for Jan20 and Feb20 vs normal U.S. PwHDDs, where normal was defined using a mix of 30-, 20- and 10-year averages for these months – these adjustments were based on a PwHDDs dataset provided by DTN. Likewise, U.S. industrial demand was also reduced by a fraction of the residential and commercial downward adjustments, as industrial demand also exhibits winter-seasonal consumption characteristics, though much less pronounced than the residential or commercial sectors. Although Mar20 is just starting, forecasted U.S. PwHDDs data were compared to normal U.S. PwHDDs for March, using the above methodology, to get the Mar20 downward adjustments. Since EIA consumption data is lagged 2 months, this methodology provides reasonable demand adjustment assessments for this scenario.
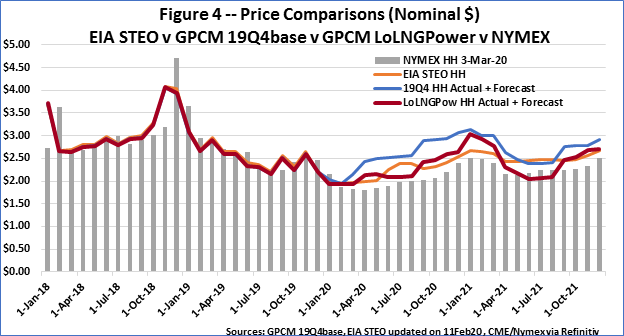
This is not a doomsday scenario, but as Figure 4 above shows, it is certainly a more bearish forecast than the RBAC’s outlook. Prices hold flat in the low $1.90/MMBtu range through Mar20 and then only gradually rise throughout the summer, not breaching the $2.15/MMBtu level until Sep20. Early on, this forecast matches quite well to the monthly average of the gas daily prices reported for Henry Hub, where Jan20 equaled $2.01/MMBtu and $1.88/MMBtu for Feb20.2 It also matches quite well with current futures prices which have tested and held the 2016 lows, at least for now, and currently suggest that prices are not going to plummet, holding relatively stable around $1.80 – $1.90/MMBtu; but things can rapidly change in futures trading. Looking further out the price curve, this scenario sees prices peaking in Jan21 just over $3.00/MMBtu, which is still significantly higher than the current NYMEX Jan21 price of around $2.65/MMBtu. Given that futures prices have overshot the last few Dec – Jan periods relative to where Henry Hub actualized, based on monthly averages of gas daily prices, it may be warranted to take a more conservative perspective.
As suggested in RBAC’s article, “It Takes Two to Tango – Supply Growth is Slowing but Demand is Needed to Revive Prices”, if demand falters, prices will struggle to strengthen. There are indications that supply is slowing, and producers are starting to talk about scaling back not just capital expenditures but production as well. Should demand fail to live up to expectations, or levels needed to tighten balances, continued downward pricing pressure appears likely. As this lower gas-fired power generation demand and LNG exports scenario illustrates, a $0.50/MMBtu decline is reasonable this summer, with summer 2021 seeing an approximate $0.30/MMBtu decline.
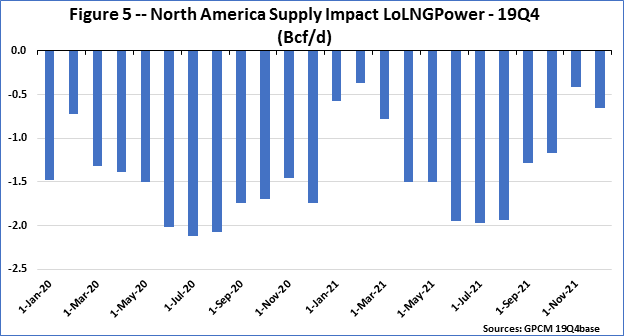
Few things, if any, operate in a vacuum when it comes to economics. Price movements lead to responses from both supply and demand until a new equilibrium is achieved. This is the case with the above scenario, where lower prices lead to lower supply which helps mitigate even lower prices. As shown in Figure 5 below, supply reductions for 2020 average 1.4% vs RBAC’s outlook, or -1.6 Bcf/d lower, while 2021 is 1.0% lower on average, or -1.2 Bcf/d. How quickly supply or demand respond to prices is something GPCM users can control by modifying supply and demand curves based on their own proprietary information and assumptions.
GPCM provides users a very easy and straightforward method for setting up such scenarios to quickly assess potential market impacts. Future articles will further demonstrate GPCM’s capabilities and ease of use, as RBAC continues to investigate how the current low gas price environment and Covid-19 issues impact the global gas supply and demand market dynamics. But as this article shows, the importance of exports to U.S. energy producers have intertwined U.S. markets to global supply/demand dynamics. Integrating GPCM with our G2M2® Global Gas Market Modeling System™ ensures capturing the feedback mechanisms associated with global market dynamics. Having such capabilities can help safeguard business decision-making, operations, and risk management practices so that the next time a sneeze occurs, us analysts can be ready to simply hand a box of tissues and say, “Gesundheit”, or even more fitting 长命百岁.
[2] Average of the Platt’s Gas Daily prices for Henry Hub location