Due to the COVID-19 pandemic, the City of Wuhan has been under strict quarantine since January 23. With current signs of improvement of the situation in China, Wuhan plans to lift the quarantine on April 8. The outbreak took a heavy toll on many of China’s industries over the past few months. However, starting in March China had begun to restart their economy and we are starting to see some recovery of their industries, albeit a bit slow.
Other countries in Asia took a different economic approach to the pandemic. Japan and South Korea for example did not stop production on a large scale. Due to this approach there will be no significant recovery period in these nations. So, when it comes to the Asian markets, China remains the primary focus.
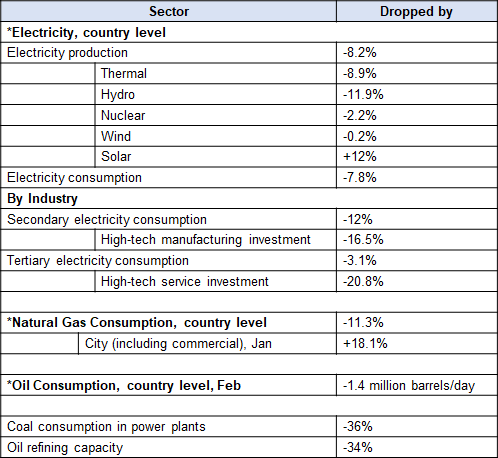
As you will see in Chart 1 below, China’s electricity production decreased by 8.2% year-on-year. In addition to the increase in solar power generation, from January to February, thermal power, hydropower, nuclear power, and wind power generation decreased by 8.9%, 11.9%, 2.2%, and 0.2% respectively. From the perspective of power consumption, from January to February, the country’s total electricity consumption fell by 7.8% year-on-year, a sharp drop of 12.3 percentage points compared with the same period in 2019, and a sharp drop of 21.1 percentage points compared with the same period in 2018. The electricity consumption of the secondary and tertiary industries decreased by 12.0% and 3.1% respectively year-on-year. Among them, as the two major industries driving the increase in power consumption, investment in high-tech manufacturing and high-tech service industries fell by 16.5% and 20.8%, respectively.
From January to February, national natural gas consumption also fell 11.3% year-on-year. Except for the slight increase in city gas, all other gas consumption declined sharply; the China LNG ex-factory price index released by the Shanghai Petroleum and Natural Gas Trading Center dropped from 4,335 yuan / ton in early December last year to 3190 yuan / ton on March 11, a decline Close to 30%.
During the pandemic, Coal consumption in power plants has dropped 36 percent, and oil refining capacity has been lowered by 34 percent.1
Chart 1: Energy Change in January and February, year-on-year 2 3
As you can see in Chart 2 below, the new energy vehicle industry has also become a “heavy-hit area” that has been heavily affected by the epidemic. Following the January-on-year decline in national production and sales of 55.4% and 54.4%, February production and sales continued to be sluggish, falling 82.9% and 75.2% year-on-year respectively.
Chart 2: New Energy Automobile Industry Reduction Rate, year-on-year

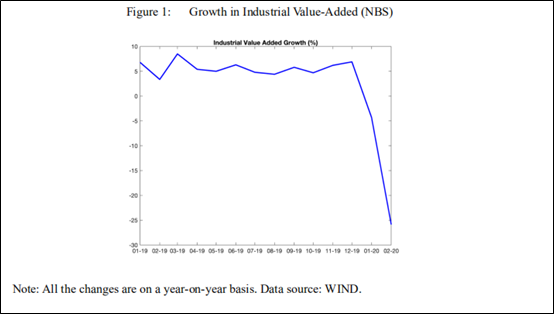
Figure 1 below shows that industrial value added fell by 4.3% and 25.9% in January and February of 2020 on a year-on-year basis. If the counterfactual growth in absence of the pandemic is 5.7%, the average growth in 2019, the slump would be even more dramatic.
Estimation of the amount and speed of recovery after such a global pandemic is very difficult. By mid-April we expect to see the release of some important indexes, such as total electricity consumption in March, that will help us get a better sense of the current rate of recovery. However, presently there are several indexes that are giving us some good initial indicators such as re-operating rates and workforce flow.
It is also difficult to estimate what kind of impact the global spread of Covid-19 will have on Chinese industries. On the one hand, international flows are reduced, foreign trade is reduced, flights are significantly reduced, and production capacity may shrink. On the other hand, due to the intensification of the pandemic, Chinese factories have successively received orders for bulk medical supplies from foreign countries, and the production capacity has continued to expand. This may be an opportunity for China to increase the rate of recovery.
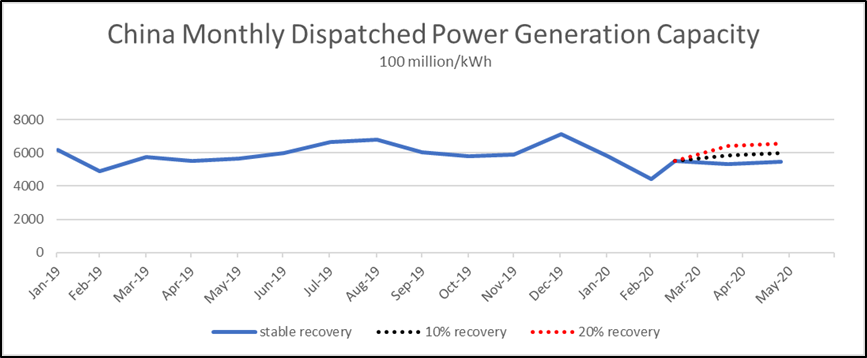
Another sign of recovery has been in seen in electricity consumption, which has picked up significantly since March. The dispatched power generation capacity on March 16 reached 17.8 billion kWh, up from 16.2 billion kWh at the end of February, an increase of 9.9%4. On March 19, the daily coal consumption of the six major power plants along the coast reached 550,000 tons, which is close to the normal value of previous years.
As of March 13, the average operating rate of industrial enterprises above designated size5 except Hubei exceeded 95%, and the operating rate of small and medium-sized enterprises reached about 60%.
In the Photovoltaic industry the overall resumption rate jumped from about 50% In mid-February to average over 80% in mid-March with some provinces exceeding 90%. In the Yangtze River Delta region where photovoltaic manufacturing companies are concentrated, local government support is very strong, and problems such as shortage of raw materials and traffic obstruction have been significantly improved and overall product supply has not been affected.
The impact on gas companies has been quite sharp from January to February and downstream orders may not recover on a large scale until April. If the pandemic situation improves enough by the end of April, natural gas consumption this year is expected to increase 6%-8%. If we do not start seeing significant improvement until June, the total gas consumption in 2020 is still expected to match 2019 consumption.
According to IHS natural gas and LNG experts, the Covid-19 pandemic will cause the growth rate of natural gas consumption to fall by 2 percentage points. It is expected that China’s natural gas consumption will increase by about 6% year-on-year to 321 billion cubic meters in 2020. The annual increase in natural gas consumption is less than 20 billion cubic meters.
By the end of March, large numbers of dedicated freighters had arrived in China to pick up face masks and other equipment being made in large quantities after the country was able to stop the spread of COVID-19 and reopen factories. No longer requiring as much equipment for its own use, China is churning out millions of pieces of personal protective equipment and other medical items.6
The French Minister of Solidarity and Health said that this freighter connection is part of a plan to import 1 billion masks to France over the next 14 weeks. On March 23, China provided 25.5 million medical masks to Russia at one time. New York Governor Andrew Cuomo said on March 31 that 17,000 ventilators have been ordered from China.
Take masks for example, according to the National Development and Reform Commission, as of February 5, China’s daily output of masks was 14.8 million, of which N95 masks were 116,000. At that time, 14 million masks were consumed daily by medical personnel. By February 29, the daily output of masks nationwide, including ordinary masks, medical masks, and medical N95 masks, reached 116 million. According to data released by the company investigation, by mid-March the number of companies that converted to masks across borders had reached 15,528.
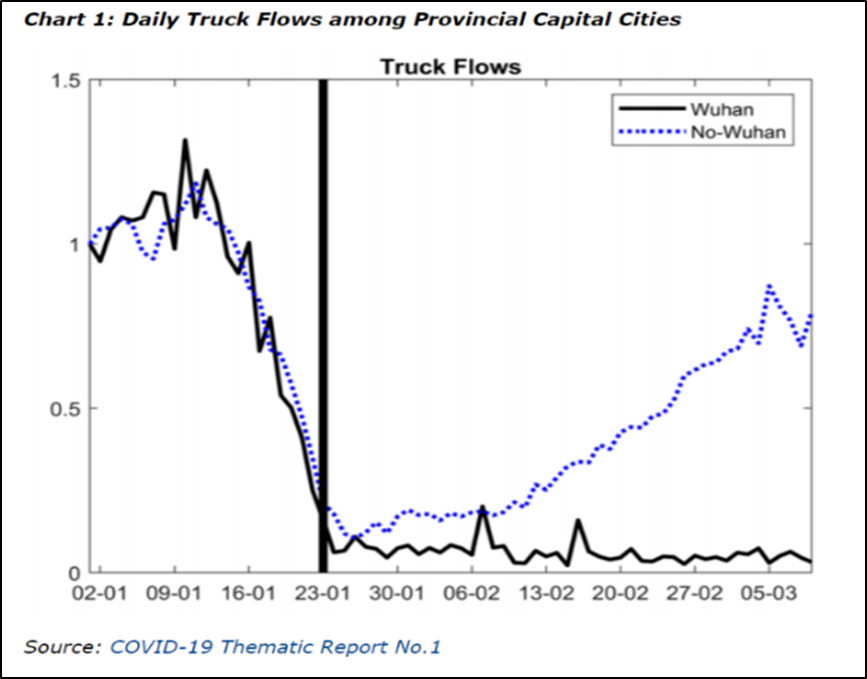
According to the Covid-19 Thematic Report No. 1 chart below, daily truck flows among the other provincial capital cities have been recovering. The decline of truck flows before Wuhan lockdown captures the slowdown associated with the coming Chinese New Year. Strikingly, the truck data suggests good flows between Wuhan and the other provincial capital cities remained at a very low level and did not recover at all since the lockdown.
An alternative data on showing improvements of industrial output are the shipment of goods across Chinese cities. The labor force flow is a good index to see how industry and business is on getting back on track.
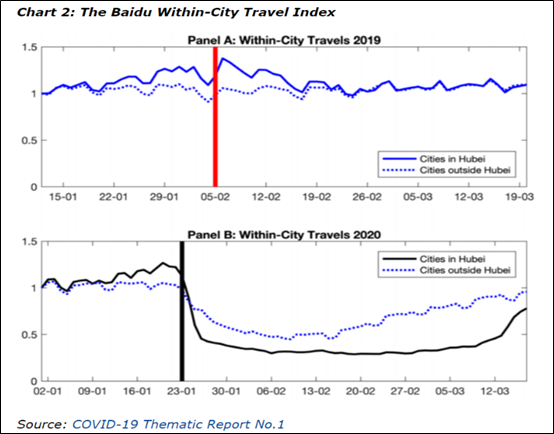
Chart 2 below shows the flow of people within and between cities in 2019 and 2020. The red bar in Panel A marks the 2019 Chinese New Year. The black bar in Panel B marks Wuhan lockdown, two days before the 2020 Chinese New Year, which exactly precedes the free fall of within-city travels in Hubei. The index dropped by more than half within a three-day window and remained low for six weeks, only to pick up recently until mid-March. The indices outside Hubei were picking up more rapidly and have almost reached the level of early January.
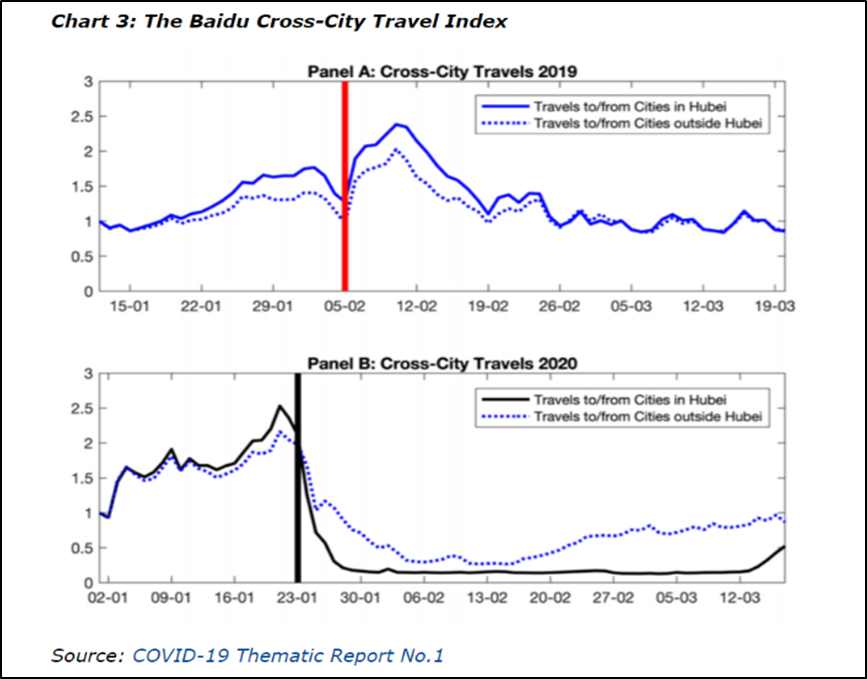
The movement of people across Chinese cities were more severely affected, as shown in Chart 3. The travels to/from cities in Hubei were nearly frozen. The cross-city travels that do not involve Hubei cities also experienced sharp declines, though to a less extent than those involving Hubei cities. By mid-March, the cross-city travels outside Hubei had fully recovered to its early January level.
Although China has been a main focus in this study, it is important to also understand the impact that Covid-19 has had on other countries throughout Asia. Based on what has been observed in China, such as the impact on natural gas consumption in the residential, industrial and electric sectors during the lockdown and the rate of recovery we have seen thus far, RBAC’s G2M2® global gas modeling team created 2 separate scenario using the curves in China on other Asian countries resulting in some very interesting insights.
On April 7, Japan declared a state of emergency over COVID-19. Japan had the fewest confirmed infections among the group of the seven leading economies in Asia at about 4,000, despite being one of the first countries outside of China to get confirmed cases.
Oil product sales, including gasoline and jet fuel, slumped more than a quarter by the end of February. Jet fuel sales sunk nearly 80% as Japanese and global airlines canceled flights to China and other destinations. But Japan’s biggest refiners say they were not planning to cut production as of March 6.
Gasoline sales fell 2.3% to 750,000 barrels per day (bpd) in the week through Feb. 29, while bunker fuel was down more than 20% for A-fuel and naphtha sales were off by 84%.
Aaron Cheong, an oil products analyst at Energy Aspects estimated domestic Japanese oil product demand in the first quarter will fall by an average of 7-8% year-on-year, both as a result of slowing economic activity as well as a result of the Covid-19 pandemic.
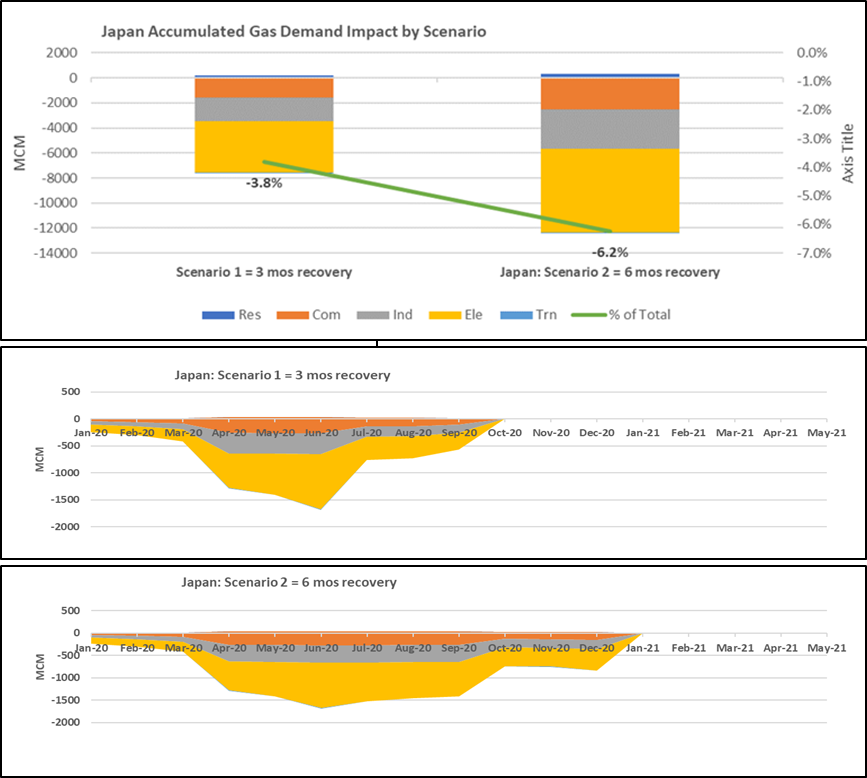
The two scenarios generated with RBAC’s G2M2® Global Gas Marketing Modeling System™ showed a significant reduction in gas consumption based on the rate of recovery. A 3-month recovery cycle showed a 4% reduction while a 6-month showed a 6% reduction in Japan. Different sectors have different recovery rates. There is a relatively large proportion of electricity gas consumption in Japan, which leads to bigger impact on electricity sector than others.
In India, the lockdown announced by the government to control the Covid-19 pandemic will adversely impact electricity demand, cash flows and lead to payment delays for power generation and transmission companies, ICRA said on Monday.
The shutdown of the industrial and commercial establishments and stoppage of passenger railway services has resulted in a 40% reduction of domestic gas demand. India’s peak electricity demand came down to 145,495 MW on 23 March from 163,729 MW on 20 March, an 11% decrease. India’s peak demand in FY19 was 168,745 MW and touched an all-time high of 176,724 MW in April last year.
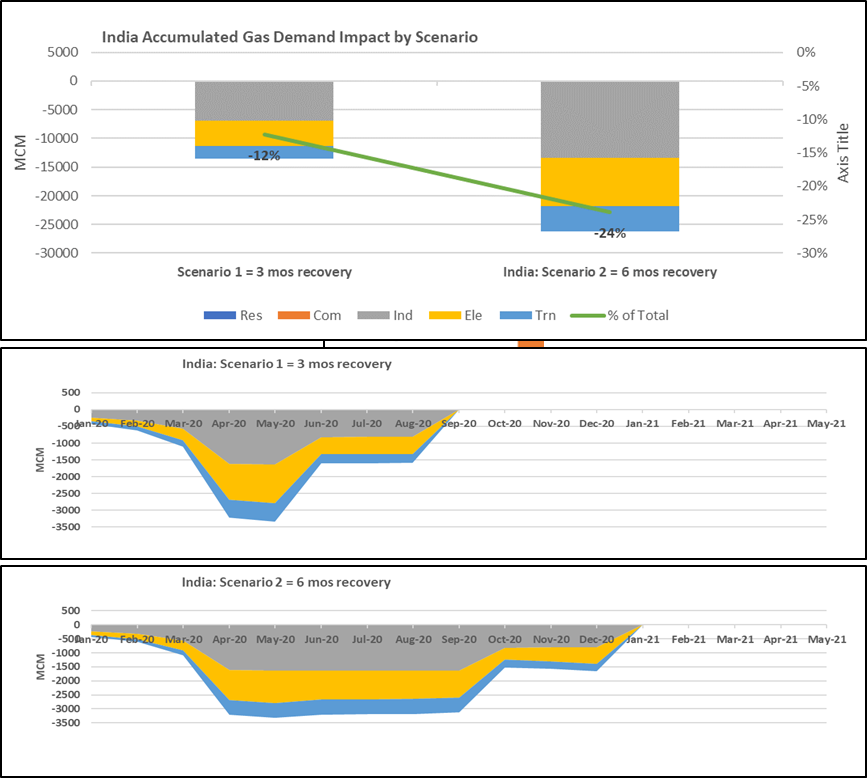
Using the similar method in Japan to estimate how COVID-19 will impact natural gas consumption in India. From charts following, accumulated gas demand impact is 12-24% depending on its recovery time. Gas consumption in industry and electricity shares a large proportion in India, leading a huge impact during the lockdown. That’s why gas consumption in India will drop more than that in Japan.
There is no surprise that with the global economic shutdown, lockdowns, stay-at-home orders and social distancing, domestic natural gas demand took a hit along with LNG imports. The top four LNG import countries, Japan, China, South Korea and India7 all showed a drop in demand for LNG imports. However, the total impact of the Covid-19 pandemic on the markets will ultimately depend on the length of time it takes to flatten the curve of the pandemic enough to justify reopening the economy and getting people back to work. From a market fundamentals point of view, it is very important to be able to run many different scenarios around the potential size of the crash and rates of recovery to better understand the remaining risks and potential opportunities that exist. Only this would give each individual company and the industry the best chance to navigate through these uncertain times and prepare for the future.
2. Source: http://energy.people.com.cn/n1/2020/0325/c71661-31647691.html
3. Source: http://ccnews.people.com.cn/n1/2020/0330/c141677-31654268.html
4. Source: China National Energy Administration
5. “Enterprises above designated size” is a statistical term used in the People’s Republic of China to refer to industrial enterprises with annual main business revenue of 20 million yuan or more.
6. Source: https://finance.yahoo.com/news/airlines-governments-3pls-creative-emergency-192257163.html
7. Source: https://www.statista.com/statistics/274529/major-lng-importing-countries/