Authored by Dr. Ning Lin and Jiaxin Yang.
The analysis of China’s potential economic slowdown and its cascading effects on the global LNG market reveals intricate and dynamic interdependencies. The most significant finding is the sensitivity of LNG imports to economic conditions, particularly in China, and how these conditions can instigate substantial shifts in global energy flows. Australia, Malaysia, and Indonesia appear poised to bear the brunt of reduced Chinese demand, while Europe’s increased intake of LNG underscores its growing role as a balancing force in the market.
Another interesting outcome is the indirect impact on U.S. LNG production, which underscores the interconnectedness of global markets and the complex mechanisms of supply and demand. As China’s imports dwindle, the U.S. production adjustment signals a responsive and fluid global market, capable of adapting to significant changes in consumption patterns.
This commentary illustrates the vital role of scenario analysis in understanding the potential repercussions of economic shifts within energy markets. It highlights the need for robust and adaptable strategies within the energy sector to navigate the complexities of global trade and market demand. As the world continues to grapple with economic uncertainties and the push for cleaner energy sources, the insights gleaned from such analyses will be crucial for industry stakeholders to make informed decisions and maintain market stability.
Key findings:
- GDP Growth Scenario: China’s expected growth is 5.2% in 2023, gaining from reopening after its zero-covid policy. In a recession scenario, China’s growth could slow to 1% in 2024 and 2025.
- Shift in LNG Imports: In the recession scenario, China’s LNG imports, especially from Australia, Malaysia, and Indonesia, face a significant decline. The reduction in China’s LNG imports leads to a redirection of supplies, with Europe absorbing more LNG initially intended for China.
- Impact on U.S. LNG Exports: The global shift in LNG demand and supply dynamics, influenced by China’s recession, results in a downturn in U.S. LNG exports.
- Price Effects: The Northeast Asia LNG import prices are projected to decrease by $0.60-1.00/mmbtu between 2024 and 2026, while European prices remain relatively stable.
China’s GDP growth and an alternative recession scenario
The comparative GDP growth of China, the United States, and India offers a window into the unique economic trajectories and developmental stages of these countries. The United States, with a definitive positive GDP growth rate of 2.6%, better than expectations, in 2023, reflects the pattern of a mature economy, marked by steady growth and diversity across sectors such as services, manufacturing, finance, and technology. The U.S. boasts a robust infrastructure, a significant consumer market, and a culture of innovation and entrepreneurship.

On the other hand, China, in its first year after the reopening of its economy after its zero-covid policies, has an expected growth rate of 5.2% in 2022 per the World Bank. Its economy is primarily driven by manufacturing, exports, and investments, supported by an extensive workforce and governmental backing. India is set to emerge as the fastest-growing economy in 2023, with a projected annual GDP growth rate likely over 7%. This growth is fueled by a diverse and dynamic economy that leverages sectors like IT, services, agriculture, and manufacturing.
India’s economic ascent is also underpinned by demographic advantages, with a youthful and growing population compared to China’s aging and shrinking one. While China’s economy has historically outpaced India’s by over 1.5 percentage points annually, India’s real GDP growth is expected to be over 2 percentage points higher than China’s every year over the forecast horizon.
The importance of this GDP comparison and economic analysis in the context of global LNG markets cannot be overstated. As these economies grow and evolve, their energy needs, particularly in terms of LNG demand, will shift, affecting global flows and pricing dynamics. Scenario planning, like that undertaken by RBAC’s G2M2® Market Simulator for Global Gas and LNG™, becomes a powerful tool in anticipating and preparing for these changes. It allows for the estimation of demand impacts from GDP, discernment of chain reactions from changes in LNG flows, and understanding regional price movements.
Such planning is not just useful for gauging the impact of a Chinese slowdown but can be adapted to consider broader global repercussions, like the domino effect of a recession in China on the economies it is intertwined with through export and business relationships.
Transitioning from the broader economic comparison, we delve into the specifics of a hypothetical recession in China, posited as a subdued growth rate of 1% for the consecutive years of 2024 and 2025. This scenario, which starkly contrasts with China’s recent growth rates and the more optimistic projections for the near future, provides a canvas to explore the ramifications of a significant slowdown in the world’s second-largest economy.
The assumption of this muted growth is deliberately simplified, maintaining the current GDP forecasts for other countries. This isolation allows for a concentrated analysis of China’s internal economic dynamics and their direct implications on the global stage, particularly within the LNG market.
In this scenario, the direct correlation between GDP growth and energy demand comes to the forefront. A slowdown to 1% growth could result in a cascading effect on China’s industrial output, consumer spending, and overall energy consumption, which would undoubtedly ripple through to the global LNG market. Given China’s significant role as both a consumer and importer of LNG, a recession could alter the demand projections, potentially leading to oversupply scenarios and downward pressure on LNG prices globally.
Methodology
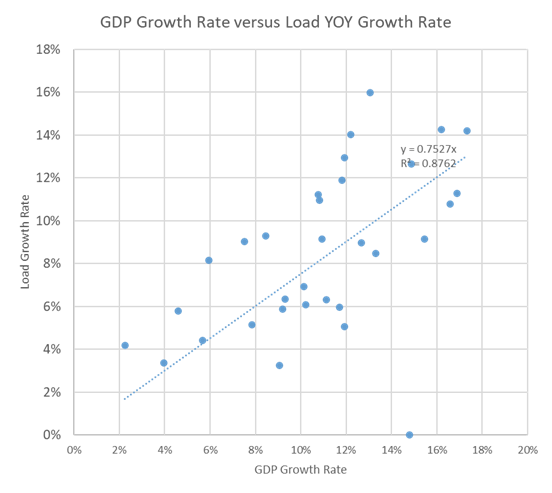
In the G2M2® model, gas demand is meticulously calculated by regressing against a set of macroeconomic indicators, including GDP, overall population, urban population density, and other relevant factors. This regression analysis enables the identification of patterns and correlations that can inform predictions about future gas demand. It is understood that gas demand varies across different sectors, each having a unique relationship with GDP and the macro indicators.
For all non-electric sectors, the regression function is linear for log terms, and we used Commercial and Industrial sectors as examples here. These two sectors have the most impact from GDP on demand from the four non-electric sectors.

When we say that in a linear regression model, the log of GDP has a coefficient of 1.2 with respect to the log of industrial gas demand, it means that there’s a proportional relationship between the two. Think of it this way: for every 1% increase in GDP, we expect to see, on average, a 1.2% increase in industrial gas demand. The ‘log’ part just means we’re looking at percentage changes rather than absolute changes. So, if the economy is booming and GDP goes up by a certain percentage, the industrial gas demand is predicted to grow even faster by a slightly higher percentage, due to this coefficient. Two potential rationales of the greater than 1 relation could be:
- Economic Scale and Energy Intensity: As GDP grows, industrial activities typically expand. If the industrial sector is energy-intensive, meaning it relies heavily on energy to produce goods, then even a small increase in economic output could result in a disproportionately larger demand for energy, including natural gas.
- Infrastructure and Capital Expansion: Rising GDP often signals that an economy is investing in infrastructure and capital-intensive projects, which can be significant consumers of natural gas. The coefficient greater than 1 could reflect that new industries and projects are coming online faster than the overall economic growth rate.
For the electricity (ELC) sector, a nested logit model is employed to calculate the share of natural gas in the incremental load each year. This sophisticated model takes into account the competition between natural gas and other generation options, such as coal, hydro, renewables, and nuclear. Additional variables, such as carbon pricing and climate change targets, are also integrated to refine the predictions.
Leveraging the established correlation between GDP growth and industrial gas demand, we adjust our previous forecasts to model alternative scenarios. These scenarios are then run through our G2M2 model to observe how they compare against our established base case from the 23Q3 release. The results from this model will give us insights into the potential variations in gas demand and the subsequent effects on the energy market, which we will explore in the following section.

In the scenario where China’s overall economic growth slows down, it’s evident from the chart that LNG imports are projected to experience the most significant decline relative to pipeline imports and domestic production. This suggests that in response to reduced demand, the flexibility of LNG as an import option is being utilized to balance the market. LNG often acts as a swing supplier due to its global availability and transportability, making it the first candidate for cuts when demand wanes.
Domestic production and pipeline imports show less volatility in response to the economic downturn. This could be due to long-term contracts, infrastructure constraints, or strategic reserves that stabilize these supply sources.

Now, let us dive into the LNG imports to China. The left chart is the base case LNG imports by origin, and the right chart is the difference between the alternative case and the base case. The negative volumes indicate how much of a decrease could be expected in total LNG imports by original supplier. We could see the biggest drop in LNG imports from Australia, then Malaysia and Indonesia.

When China reduces its LNG imports, the global LNG market must rebalance to accommodate the shift in demand. Typically, this involves redirecting supplies to other markets where demand remains robust or is growing. As per the scenario, it appears that while the rest of Asia, does absorb some of the LNG originally destined for China, the increase is modest, suggesting that these markets have a limited capacity to offset China’s decrease.

Europe emerges as a more significant destination for LNG originally intended for China. The reason the continent’s LNG imports may rise could be due to various factors, such as efforts to diversify energy sources away from pipeline gas, particularly in the context of political and supply uncertainties, or increased demand due to economic growth or colder weather conditions.
However, the total redirected LNG to Asia and Europe does not fully account for the reduction in China’s imports. This discrepancy indicates that the global LNG supply adjusts, not just through rerouting of flows but also through a reduction in production. Notably, U.S. LNG exports experience a downturn as a response to the new market equilibrium as illustrated below in the Base Case versus China Recession scenario.

The indirect impact on U.S. LNG production underscores the interconnected nature of global energy markets. Changes in demand in one major consumer can affect supply strategies and production levels worldwide. Factors like flexible supply contracts, variable production costs, and the agility of the U.S. LNG sector to respond to market signals likely contribute to this adjustment. This complex dance of supply and demand highlights the need for global LNG markets and players to maintain flexibility and adaptability in the face of shifting consumption patterns, ensuring that supply can efficiently find its way to areas of demand while allowing for production scaling in response to global market conditions.
RBAC, Inc. has been the leading provider of market fundamental analysis tools used by the energy industry and related government agencies for over two decades. The GPCM® Market Simulator for North American Gas and LNG™ is the most widely used natural gas market modeling system in North America. RBAC’s G2M2® Market Simulator for Global Gas and LNG™ has been instrumental in understanding evolving global gas and LNG dynamics and is vital in fully understanding the interrelationship between the North American and global gas markets.