John Collins and Scott McKenna, RBAC, Inc.
Tom Brady may have solidified his status as NFL’s “GOAT” – Greatest Of All Time – Quarterback with Tampa Bay’s Super Bowl win nearly 1 month ago. Deemed too old by some and likely not able to replicate his success at the New England Patriots, Brady proved such skeptics wrong. But in no small part, what made Tampa Bay’s win possible was the experience that age and exposure provide; as well as the physical and mental preparation that the GOATs undertake as they aspire to achieve such status. For many of us, we drink our beers, eat our chips, and critique the outcome, with the benefit of 20/20 hindsight. We then explain how we would have done things differently and better – the proverbial Monday morning quarterbacking, unless, of course, our team was victorious.
So, what does Tom Brady, the Super Bowl, and Monday morning quarterbacking have to do with the weather? Nothing really. It does, however, demonstrate how preparedness, reading signals (think reading defenses), and understanding how to adapt to different scenarios can lead to much more favorable outcomes. A case in point is the extreme cold weather that hit the U.S. during the week of 14 – 20 February, plunging deep into Texas and even portions of northern Mexico.
This devastating weather event caused the Texas power grid, ERCOT, to destabilize. Starting on Valentine’s Day, frequency levels dropped to 59.3 Hz as both fossil and renewable generation outages increased. In a matter of 65 minutes, beginning at 12:15am on 15Feb21, ERCOT went from ordering an Emergency Operations Level 1 to the highest level, Emergency Operations Level 3, at 1:20am. Level 3 means the system’s stability is in a critical situation and load shedding measures need to be implemented. During this 65-minute period, ERCOT ordered utilities to start shedding load and customers began experiencing power outages that for many would last days, despite expectations that these outages would be rolling – i.e., lasting maybe a few hours. From late 15Feb through most of 16Feb, upwards of 20,000 MW of load was shed, allowing the grid to stabilize around 45,000 MW.
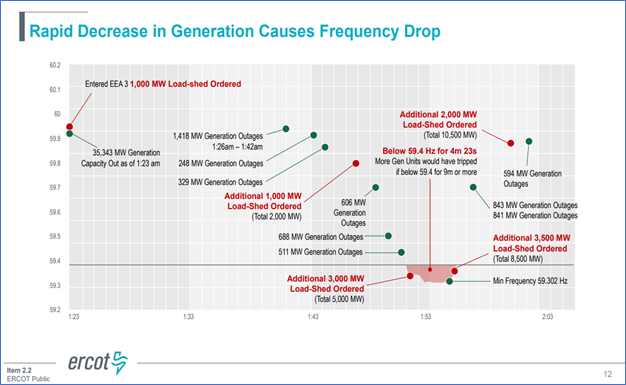
Source : http://www.ercot.com/content/wcm/key_documents_lists/225373/2.2_ERCOT_Presentation.pdf
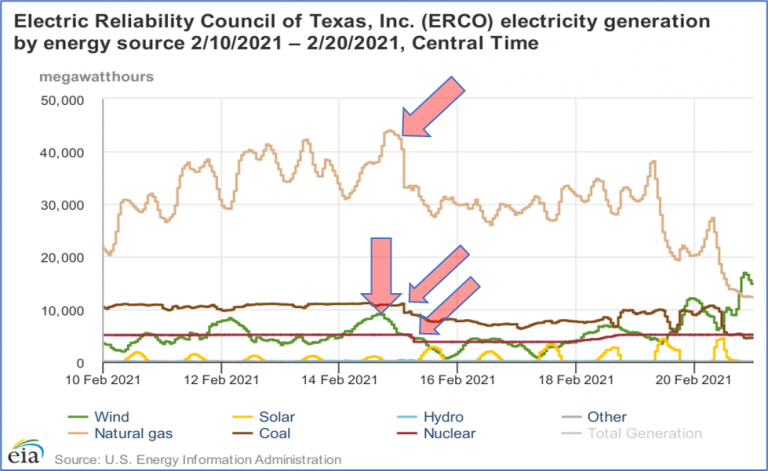
At the highest point, over 52,000 MW of generation was unavailable (48.6% of total) due to extreme weather.[1] The failure of generation units was not limited to any fuel source type. Wind, solar, natural gas, coal, and even a nuclear unit experienced forced outages. When the sun doesn’t shine or panels are covered in snow, solar doesn’t produce and battery storage capacity is still woefully inadequate to offset any generation outages of this magnitude and duration. Similarly, when the wind doesn’t blow, wind generation is non-existent. But in this case, it was both a lack of wind and frozen turbines. At certain points, over 25,000 MW of gas-fired generation had forced outages due to a combination of an inability to obtain fuel and weather-related equipment malfunctions. Similarly, coal experienced weather-related issues leading to less generation availability. Finally, the cold weather caused a feedwater pump sensor malfunction at the South Texas Project nuclear power plant Unit 1, leading to an automatic shutdown and forcing approximately 650 MW of capacity offline.[2]
Given the abundance of natural gas supply in Texas and its dominant role as a fuel source for power generation in the state, an obvious question is, where was the natural gas to step in and fill the void? It is not a new phenomenon that natural gas and oil wells can and do have issues in cold weather. In fact, it’s almost a given every winter, that when freezing temperatures descend into areas where oil and natural gas wells are located, well freeze-offs are a likely, regular event. Granted, this most recent extreme cold affected a large swath of production areas simultaneously and was much more extreme in both absolute and wind chill adjusted temperatures. But the natural gas market recognizes the impacts that weather can have on production due to well freeze-offs and prices quickly respond to reflect these impacts of lesser supply.
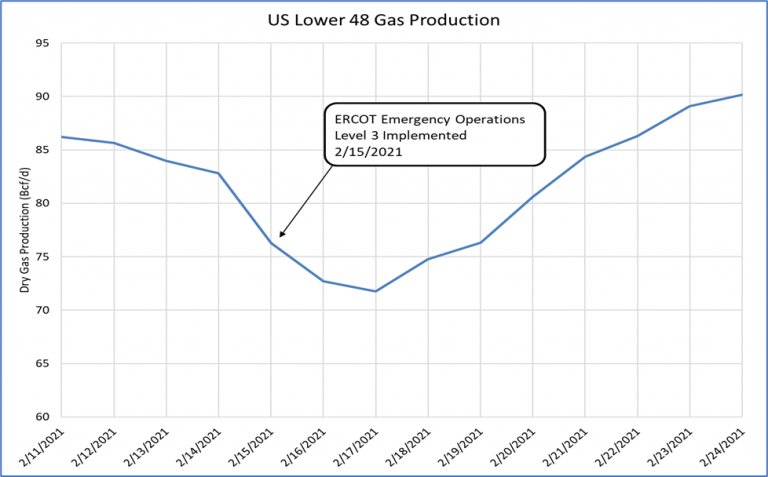
Source: Derived from pipeline nomination data provided by Criterion Research
This time was no different. In fact, this time natural gas prices were signaling the impending significance of well freeze-offs and higher demand the week prior to the weather event hitting Texas, as several locations hit record high cash prices. Starting on 11Feb, gas prices began their ascent as many affected locations saw daily percentage increases well over 30%; though absolute prices remained below the $10/MMBtu price level. It’s important to note that natural gas is traded for the day ahead in the cash market, meaning that prices for 11Feb21 (Thursday) were being transacted on 10Feb21 (Wednesday). Also, for the weekend, trades on Friday represent gas purchases and sales for the Saturday through Monday package in normal situations. Monday, 15Feb21, was President’s Day holiday, so trades on Friday, 12Feb21, also included Tuesday, 16Feb21, as part of the weekend package.
While the focus was understandably on power outages and prices, it is remarkable that natural gas prices exceeding $100/MMBtu barely made the news. As can be seen in the chart below, prices dramatically increased in Thursday’s trading for Friday gas needs. All points in the major producing areas, excluding Appalachia, gained well over 50% vs. previous day prices. Points in Texas started to breach the $10/MMBtu levels. At this point, the situation was not necessarily dire, but prices were signaling that things were getting significantly tighter as market participants endeavored to ensure natural gas supply for their demand needs. By Friday, 12Feb21, weekend packages (again, to include Tuesday), jumped even more dramatically. Numerous locations saw well over a 10-fold increase vs previous days prices ( the flat portion from 14Feb through 16Feb represents the weekend package effect). Once the cash markets opened again Tuesday, gas scarcity still existed and further price gains were seen for the next few days.
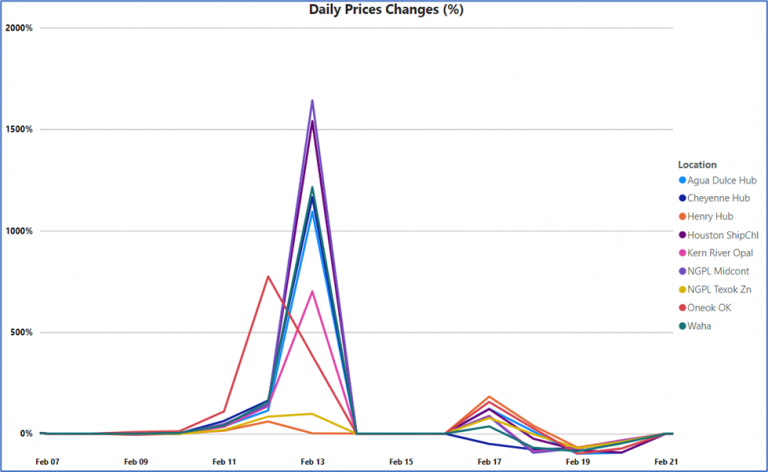
Source: Derived from Platt’s Gas Daily Prices
Shortly after, ERCOT system prices began to rapidly increase, reaching 7,000 $/MWh at 9am on February 14th in the day-ahead market. They eventually reached the market price cap of $9,000/MWh for nearly every hour of February 17th. For context, ERCOT day-ahead prices averaged approximately 23.42 $/MWh across all hours between February 1st and February 10th, 2021.
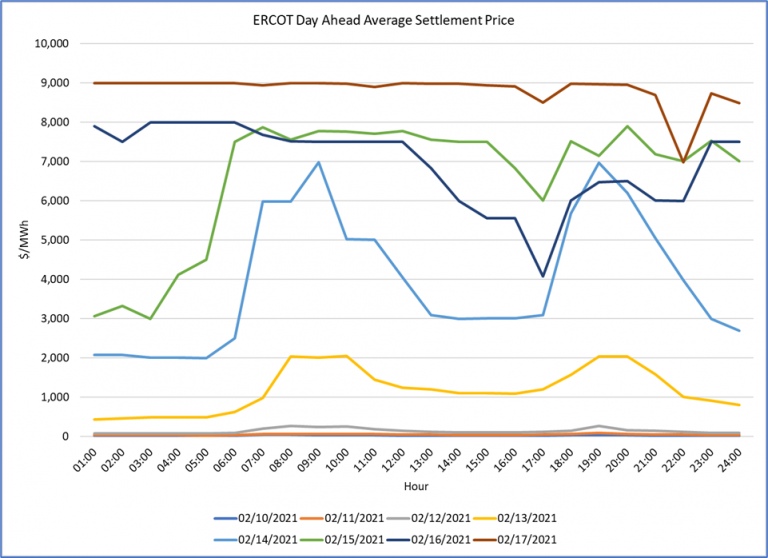
Source: ERCOT Settlement Point Prices
Suffice it to say, the natural gas market provided some unique insights and early price signals of the impending challenges that power generation was likely to face. When gas prices increase with such ferocity, the market is telling participants that molecules are in high demand and supply is insufficient – i.e., extreme supply/demand tightness. As noted above, it is quite common for well freeze-offs to occur, thereby significantly impacting the supply side of the equation. It’s during these cold weather events that demand simultaneously is increasing for space heating needs, either directly from natural gas or via electricity, which is still heavily reliant upon natural gas as a fuel source. Even with stronger market penetration from renewables, their intermittency requires alternative power generation capacity to stand ready to maintain electric reliability. With the ongoing retirements of coal and nuclear generation, this burden will continue to fall on natural gas. Could the early warning signals from rapidly strengthening natural gas prices have allowed grid managers greater flexibility maintaining grid stability through such mechanisms as initiating rolling outages earlier, say on Saturday, 13Feb? Were massive well freeze-off scenarios previously vetted, given the knowledge that freeze-offs are a regular occurrence? Would rolling outages have allowed gas infrastructure that’s dependent upon electricity for operations to stay online?
The solution, at least in part, appears to reside in infrastructure “winterization”. Enhancing the reliability of current infrastructure so that it can withstand extreme cold temperatures will help mitigate the risk of power outages. How quickly this can occur, and the extent to which consumers, regulators and asset owners are willing to incur the associated costs, will no doubt be debated.
However, like the GOATs of our favorite sports, understanding the holistic dynamics of the industry can be achieved through preparation, scenario analyses and planning. Likewise, recognizing the signals being sent, and more importantly, reading, correctly interpreting, and then appropriately executing the game plan, is exactly what makes GOATs, GOATs. Beyond pure athleticism, it’s what separates the best from the Monday morning quarterbacks.
Scott McKenna and John Collins serve on RBAC’s GPCM Natural Gas Fundamental Modeling team, with key responsibilities focused on the development of both supply and demand related GPCM components, scenario analyses, customer support and production of RBAC’s quarterly releases. Additionally, they have been working on new product offerings including RBAC’s Add-On Visual Analytics services.
Scott has decades of experience in trading energy commodities, hedge fund management, and fundamentals modeling and analysis. Meanwhile, John has nearly 10 years of experience in the energy industry in both government and the private sector. His areas of expertise are power & gas markets, mathematical modeling, energy economics, and federal regulations. Scott, John, and the rest of the GPCM team and technical staff at RBAC continue to advance RBAC’s optimization modeling systems so that energy market participants can efficiently and accurately simulate the increasingly dynamic global energy industry. RBAC has clearly demonstrated itself as the global energy modeling systems leader.
[1] http://www.ercot.com/content/wcm/key_documents_lists/225373/2.2_ERCOT_Presentation.pdf
[2] https://www.nrc.gov/reading-rm/doc-collections/event-status/event/2021/20210216en.html


