This is the first post in my mini-series of “track what matters” – a knowledge share for natural gas market analysis crowd. In this post, I discuss the logic to answer this question.
I like to iterate – when you see the charts and numbers below, keep this in mind: this is not intended to be a regular commentary about market forecasts or necessarily to pitch some software or point of view. The purpose is not to convince you, the reader, with one singular forecast, but help facilitate you form an effective thought process. I do use market data and forecast results to demonstrate (and of course share my thoughts on topics), but like I mentioned in my prior posts, my intent is to step in and share logic and methods that connect data and charts to insights and conclusions, and hope others could reference, comment and advance their own processes and work if this is any value.
The first time I recall for formal media coverage on China raising LNG tariff from the US was in fall 2018. I was visiting China with #RBAC’s founder Dr. Brooks at #CPCIF China Petroleum and Chemical International Conference in Chengdu China. Since our keynote speech was about the LNG perspective for China, the impact of potential raised tariff from US LNG became a hot topic. Fast forward a couple of months, as the trade was and negotiation continues, this topic continues to be the most asked question to me during discussions, panels and presentations, from both Chinese contacts as well as American colleagues in the energy sector.
In order to understand the impact on each country under this scenario, I took two steps to examine data and forecasts.
First – put things in perspective, in particular, what is the role of LNG for the US and China?
Based on RBAC’s G2M2® global gas market model, LNG trade is expected to grow around 5% CAGR for the next decade, from ~400 Bcm in 2017 to around 650 Bcm in 2030. Currently, LNG trade accounts for around 30% of total global trade, and US and China are taking significant roles in this sector respectively.
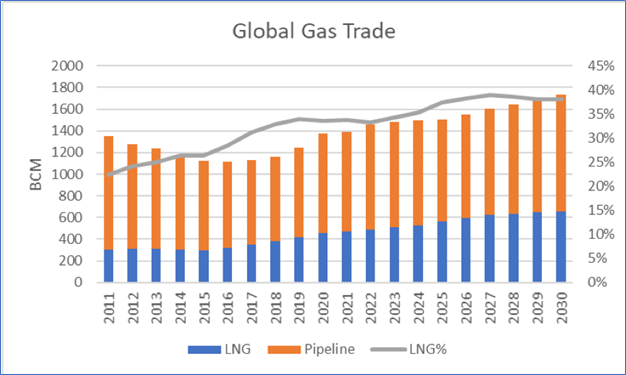
US is emerging as a major LNG exporters along with Qatar and Australia in this decade, while interestingly note LNG exports takes less than 10% of total gas production in the US currently. Going forward, as LNG is expected to grow from less than 20 Bcm to over 100 Bcm in the next decade. On the other hand, after surpassing Korea to be the no. 2 largest LNG importer in the world in early 2018, China continues to grow its need for LNG in order to doubling its gas consumption by 2040.
Second – define the alternatives, as alternatives are good way to measure value:
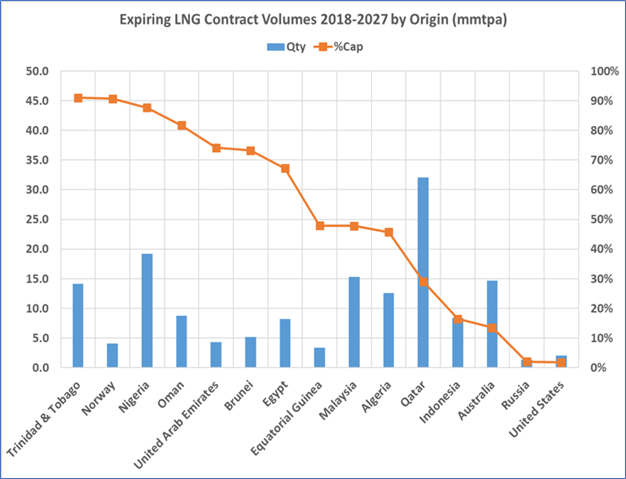
As of 2018, China has only contracted for about ½ of 2025’s expected demand and about 1/3 of what it will need in 2030.So China has an urgent needs and motive to lock in long term contracts of LNG imports. Two approaches for China LNG procurement: existing supplier or participation in new projects. There are about seven countries that have greater than 70% of their liquefaction capacities, expiring in form of contracted volume in the next 10 years. In other words, they would be actively engaging discussions for renewal and looking for new buyers. There is a total of 180 mmpta of LNG contracts expiring in next 10 years.
Besides existing terminals, there is also a tidal wave of new projects coming, led by the US, Australia, Russia and Qatar. Many of these projects need long term contracts to secure finance of the construction, while for greenfield project, it is particularly beneficial for buyers who like lock down large volume and long term contracts while willing to finance the higher fixed cost portion of the operation for a new project. So although there is an urgent need for LNG imports, China has a good range of options besides the US, for example, we forecast that China would be sourcing mainly from four countries: Australia (40%), Malaysia (20%), Qatar (15%), Indonesia (12%). Note that for currently un-contracted future LNG volume that China needs, it is determined in the G2M2 model as spot flow based on economics without further hypothesis of contracts.
For the US, with a fast ramp of liquefaction capacity, the good news is there is also sufficient market outlets. Two important points to consider here: one, global geography dictates that LNG will flow most economically from the USA to Japan rather than to China and Japan has a great deal of contract expiring in the near term. So it is likely for traditional East Asian buyers to select the USA to source much of its LNG need. However, they also likely to request more flexible destination clause as well as de-linking from oil. Two, with the commitment for an aggressive transition to low carbon energy (decommissioning coal and banning domestic shale production), Europe would be needing natural gas to balance its grid and meet energy demand. Although it is working on multiple projects from Africa as well as Russia, US LNG is a great alternative supply source for its energy security and Europe is more likely and better situated (compared to China who is limited in its storage capacity) to take advantage of extra spot cargo whenever it could as a balancing region for global LNG market. At last, US’s domestic gas is one of the most liquid and effective markets (if not the most) in the world and the US LNG exports is expected to grow significantly, but it is expected to be no more than 15% of its total production in the long run.
In conclusion, a raised tariff from the US to China would increase the risk of the US losing a very profitable and large buyer and even deter some long-term contract, especially for those companies that actively engaging, like the recent news on ENN dropped the Freeport contract (back to Toshiba). However, each has plenty of options to secure their deals with other market participating countries, even though there are some loss of leverage. Overall, despite the media hype, the trade war has minor impact on LNG sector between the US and China as a whole.