Occasionally, what appear to be relatively insignificant events metamorphosize into shockingly strong market impacting chaos. The events over the last three months truly reflect the saying “In Like a Lamb, Out Like a Lion” and are captured in the release of RBAC’s 20Q1 GPCM® Natural Gas Market Forecasting SystemTM outlook. This update includes major revisions to near-term assumptions for drivers of both supply and demand forecasts in comparison with last quarter’s 19Q4base Case Release. These revisions are primarily due to the Covid-19 pandemic, resulting mandatory lockdowns, and the brief crude oil price war initiated by Saudi Arabia due to the failure of extending OPEC+ production curtailments. Additionally, 20Q1base includes integration with the last G2M2® Global Gas Market Modeling SystemTM forecast to capture the global impacts of Covid-19 on U.S. LNG exports.
Although this past winter was a disappointment for natural gas bulls as prices failed to sustain the $2.00/MMBtu price level, the bigger issue that emerged was the Covid-19 pandemic. The virus first emerged in China during late 2019, but really started to have an impact by February 2020 when countries around the world began implementing lockdowns, with the U.S. mandating such measures in earnest in March. The difficult price environment seen throughout 2019 led to significant reductions in financing and capital expenditures which were exacerbated by the pandemic and the crude oil price and supply shock events. The combination of Covid-19 demand destruction and the oil supply shock has resulted in an unprecedented collapse in crude oil prices – negative WTI prices were seen for the 1st time ever on the NYMEX. Subsequently, rigs declined at the most rapid pace ever, and U.S. producers that were unhedged and/or faced higher operating costs began shutting in production.
The rapid shut-in response by oil producers means that associated gas production will decline as well. Given that areas such as the Permian basin have been the primary drivers of increased gas supply, natural gas futures prices have held up relatively well – holding above the $1.50/MMBtu level. What remains to be seen is how prices might advance as the world works its way through the Covid-19 crisis. How quickly will demand rebound as countries and economies emerge from the induced economic coma? Likewise, how will producers respond to the end of the crude oil price war, production curtailments recently implemented by Saudi Arabia, and the shut-ins occurring in the U.S.?
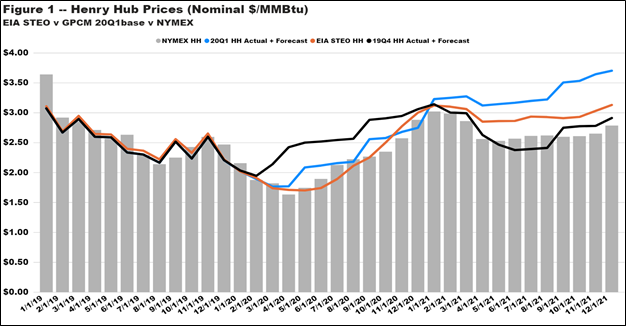
Sources: GPCM 20Q1base, EIA STEO updated on 7Apr20, and Nynex prices are settlement prices for 24Apr20.
RBAC’s 20Q1 forecast incorporates these concerns, using the latest historical data updates for both supply and demand as well as publicly available 3rd party assessments and internal economic modeling to construct baseline assumptions. Based on these inputs, the 20Q1 forecast expects gas prices to trend higher, breaching the $3.00/MMBtu in January 2021, driven by domestic production declines, especially in the oil centric basins, and to a lesser extent demand rebounding, albeit at a modest pace.
Whereas demand was the key factor for potentially higher gas prices in RBAC’s 19Q4 forecast, supply has now become equally important. Previously, supply growth was expected to continue at a robust pace with the U.S. relying increasingly upon gas-fired power generation and LNG exports to clear the market. The 20Q1 forecast now shows a dramatic supply curtailment response with U.S. production falling from nearly 97 Bcf/d in February 2020 to 88 Bcf/d during the June 2020 to August 2020 period. This is markedly lower than RBAC’s 19Q4 forecast as seen in Figure 2 below. It will take some time for production to rebound due to lingering, depression-like Covid-19 effects on demand and the financial markets. How quickly investors are willing to deploy capital and take on risk in the E&P sector remains to be seen – i.e., how will price elasticity of supply be impacted over the next several years?
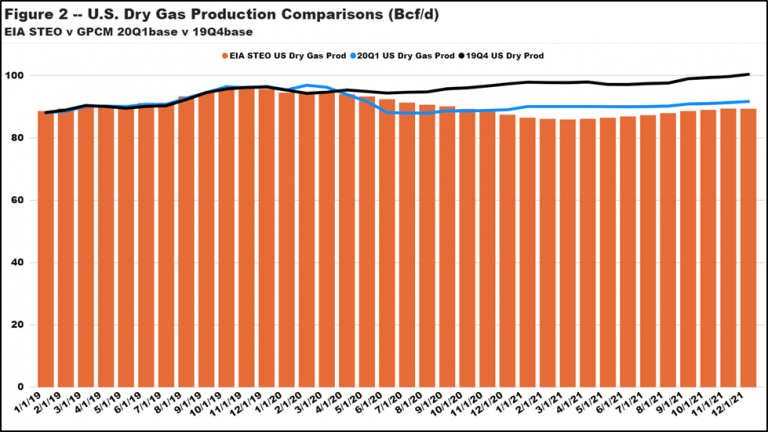
Sources: GPCM 20Q1base/19Q4base, EIA STEO updated on 7Apr20.
U.S. LNG exports are not spared the demand destruction impacts of Covid-19 as can be seen in Figure 3 below. RBAC’s 19Q4 forecast press release noted that LNG exports are playing an increasingly critical role in balancing U.S. supply and demand. With global gas demand dropping dramatically, U.S. LNG exports over the next several years are expected to be significantly lower than previously forecast. The latest integration of RBAC’s GPCM and G2M2 modeling systems suggests approximately 1 Bcf/d lower exports though the balance of 2020, while the divergence grows to over 3.5 Bcf/d during the summer of 2021 and approaches nearly 5 Bcf/d by December 2021. This dramatic drop is due to the much higher prices in the 20Q1 forecast coupled with lingering global gas demand weakness which makes U.S. natural gas less competitive globally.
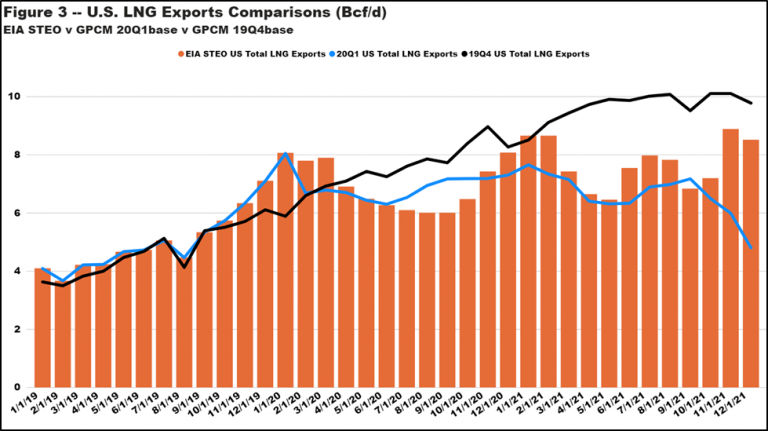
Sources: GPCM 20Q1base/19Q4base, EIA STEO updated on 7Apr20.
This does not mean that U.S. natural gas will remain uncompetitive longer term. In fact, prices remaining in the $3.00 to $3.50/MMBtu range throughout 2021 and 2022 provoke the supply response necessary to moderate prices. Simultaneously, global demand returns to more normal levels leading to a rebound in U.S. LNG exports thereafter (see Figure 4 below).
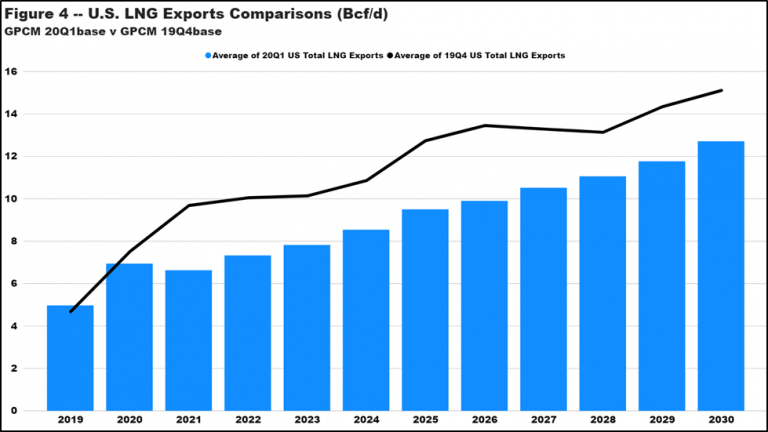
Sources: GPCM 20Q1base/19Q4base, EIA STEO updated on 7Apr20.
This highlights a very important aspect of RBAC’s modeling systems and how globally interconnected and dynamic the U.S. natural gas market has become. Should the pandemic subside sooner, and demand rebound faster, the impacts on global flow dynamics will almost certainly change. Furthermore, it is possible that the regional price elasticity of supply proves to be more, or less, responsive than estimated in 20Q1base. This could dramatically impact U.S. production dynamics, overall supply, and the ability to compete globally. These are all scenarios that can easily be constructed and executed using GPCM and G2M2. Stay tuned, a scenario focusing on these alternative assumptions is forthcoming…
U.S. domestic gas demand has been impacted by Covid-19, though not as much as crude and refined products have been due to their greater use as transportation fuels (diesel, jet fuel, and gasoline). There is, however, some spill-over effect from transportation fuels demand destruction to natural gas industrial demand. Specifically, refineries, petrochemical plants, auto manufacturing and other industrial demand related industries have significantly reduced operations – some have ceased operating all together. The 20Q1 forecast, depicted in Figure 4 below, expects this shuttered demand will remain lower than normal until 2022 – 2023. Similarly, electric power generation demand is seen softening as well, though this is more due to renewables seeing greater market penetration. It is important to note here that RBAC’s GPCM forecasts use EIA’s AEO outlook as its baseline projection with demand price elasticities applied. It is likely that this summer gas-fired power generation could be higher because the current $2.00/MMBtu price environment will make coal even less competitive. Continued retirements of coal-fired power plants and less aggressive market penetration for renewables would open more opportunities for natural gas.
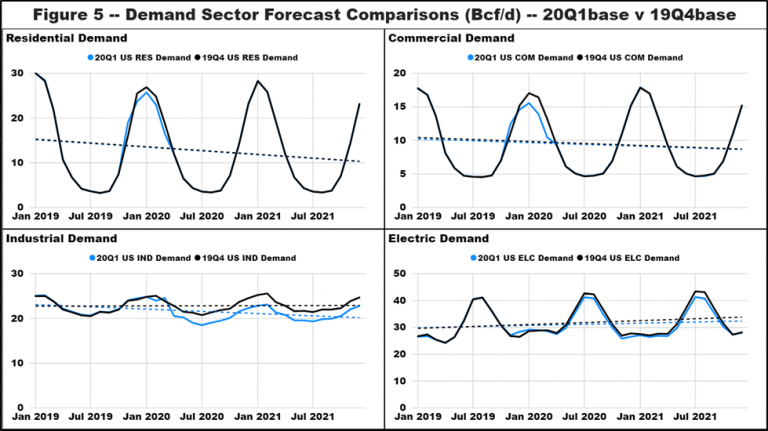
Sources: GPCM 20Q1base/19Q4base.
Regional production dynamics have changed dramatically in just the last few months. In the 20Q1 forecast, Permian supply is expected to decline sharply through mid-2020 and then remain flat at roughly 10.2 Bcf/d in the 2020 – 2021 period. RBAC’s 19Q4 forecast had Permian supply reaching 12.4 Bcf/d. Appalachian basin production sees similar moderated production growth, hovering around the 29.0 – 29.3 Bcf/d level in 2021 – 2022.
Conversely, the Arkla-East Texas “basin group”, home to the Haynesville shale play, realizes a much more rapid production rebound. For instance, 2021 Haynesville shale production is expected to exceed 13.1 Bcf/d, or only 0.1 Bcf/d lower than the 19Q4 forecast. By 2025, production is forecast to reach 16.3 Bcf/d vs the 19Q4 forecast of 14.8 Bcf/d. The stronger rebound is largely due to the region’s proximity to Henry Hub and Gulf Coast LNG export terminals. In addition, production economics suggest stronger production growth when prices are in the $3.00/MMBtu + range.
Figures 5 and 6 below show expected destinations for Arkla-East Texas 2021 supply. Comparing the two maps, one can see that overall production is essentially the same, roughly 13.2 Bcf/d, but approximately 0.5 Bcf/d less feeds Gulf Coast LNG exports, instead flowing to the West South Central (WSC) and East North Central (ENC) Census regions. These flows help offset lower production in the Permian and Appalachian basins that previously flowed to these regions – Permian to WSC and Appalachian to ENC.
Figure 6 – 20Q1 ARKLA-ETX Source Destination Flows
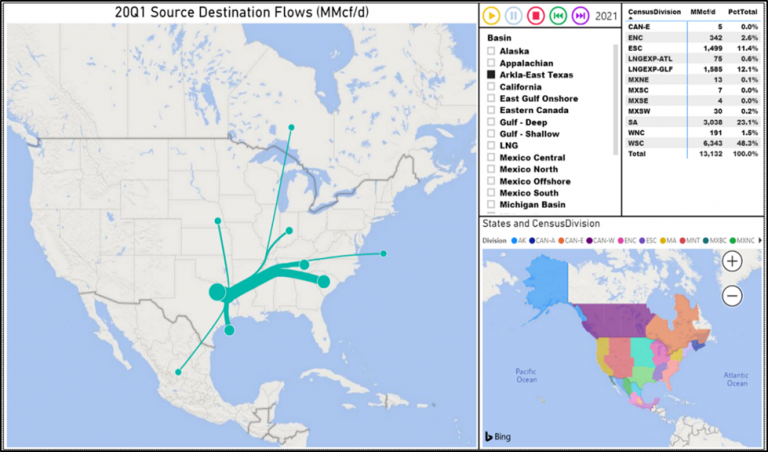
Sources: GPCM 20Q1base/19Q4base.
Figure 7 – 19Q4 ARKLA-ETX Source Destination Flows
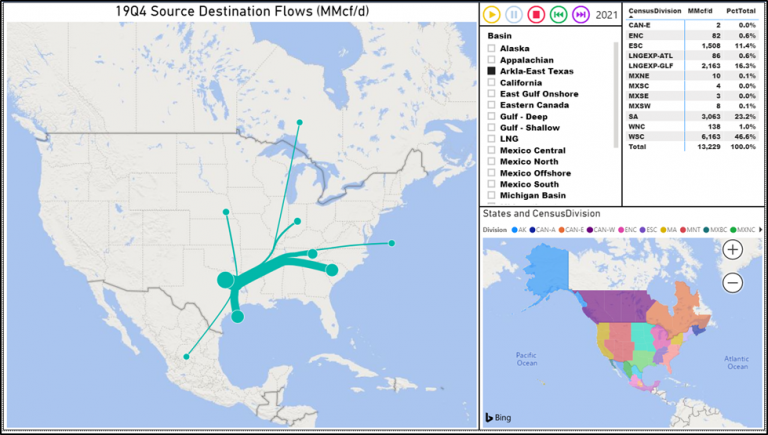
Sources: GPCM 20Q1base/19Q4base.
Covid-19, the brief crude oil price war, and the subsequent reversal to more stringent production curtailments by Saudi Arabia and shut-ins here in the U.S. have highlighted how quickly things can change in the energy industry. Natural gas is faring better than oil, but it is not immune to these supply shocks and demand destruction. Having appropriate analytical tools to construct high-likelihood as well as black swan, tail-risk events is crucial to identifying opportunities and more importantly, potentially catastrophic risks quickly and easily. RBAC’s GPCM and G2M2 modeling systems were designed to provide users exactly this capability.
RBAC, Inc. has been the leading provider of market fundamental analysis tools used by the energy industry and related government agencies for the past two decades. The GPCM® Natural Gas Market Forecasting System™ is the most widely used natural gas market modeling system in North America. RBAC’s G2M2® Global Gas Marketing Modeling System™ has been instrumental in understanding evolving global gas and LNG dynamics and is vital in fully understanding the interrelationship between the North American and global gas markets. For more information visit RBAC’s website at http://www.rbac.com or call James Brooks (281) 506-0588 ext. 126.