 Cutting CO2 emissions and decarbonization was supposed to be the main topic in global LNG markets last year. Instead, energy security has come again front and center, especially for purchasing countries.
In the case of Japan, the security of LNG supply is especially pressing because the fuel has an outsized influence on domestic electricity pricing. Assuming the government sticks to its decarbonization strategy, which says that Japan’s LNG demand for the power sector could drop 50% by 2030, retaining supply security through diversity of import sources could incur a significant monetary cost.
Below we investigate the impact of diversification strategies on Japan and its neighbor, China, which last year emerged as the world’s biggest LNG importer for the first time.
The new “normal” in LNG
The events of 2021 tested both the resilience and flexibility of the global natural gas and LNG markets and demonstrated a new “normal” based on two points:
- LNG has evolved into a truly global market; Europe and Asia, as well as other parts of the world, compete for the same cargos, while local fundamentals such as gas storage levels and renewables output impact LNG prices the world over.
- Gas and LNG supply, even as a bridging fuel, is vital to national security and the broader economy.
In 2021, countries with limited diversity of gas supply were affected heavily by even minute market fluctuations, demonstrating low price elasticity and a lack of flexibility in switching to alternatives. This led China to build three transnational pipelines and move forward with new LNG regasification terminals along its southeast coast, while also allocating more funding to domestic gas production projects.
Simulating market change
A diversification strategy for LNG sourcing might be more expensive than a pure cost-based optimization strategy, but our calculations show the price difference may not be prohibitively expensive as the LNG market matures and becomes more competitive after 2030.
To simulate the cost changes, we implemented a scenario-based approach, testing against fundamental factors that determine LNG imports into Japan and China such as long-term gas demand and the potential emergence of new infrastructure options, such as the Power of Siberia 2 (PS2) pipeline from Russia into China.
We also set credible limitations on how big a market share each LNG supplier country could have in the portfolio of the import nation. These market share limitations are based on historical data gleaned from BP’s 2021 Statistical Review and then extended into the future along realistic minimum and maximum levels. The assumptions mirror the way that countries like Japan operate to retain a balanced supply portfolio.
Such “Destination Constraints” should not be confused with “Destination Restriction” clauses on some LNG contracts, which limit to where the cargo can be delivered.
How Japan’s LNG portfolio changes
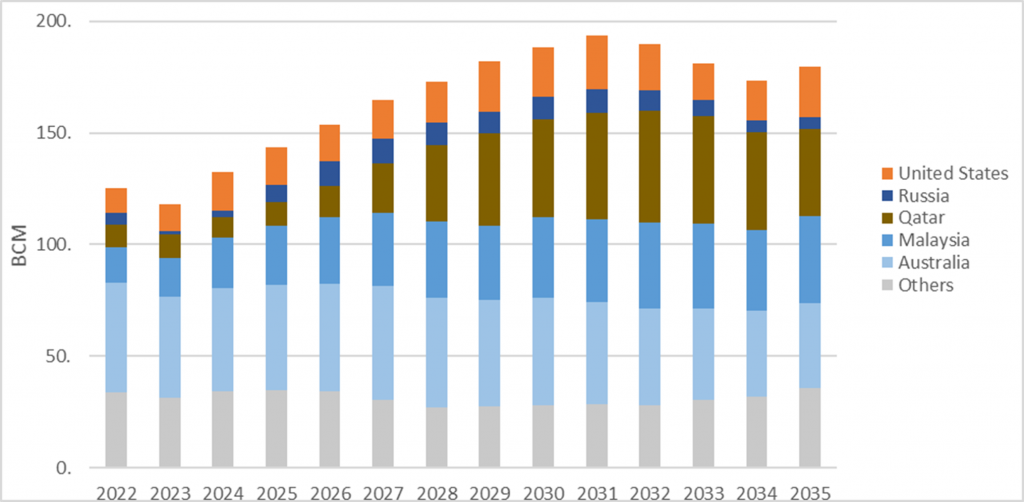
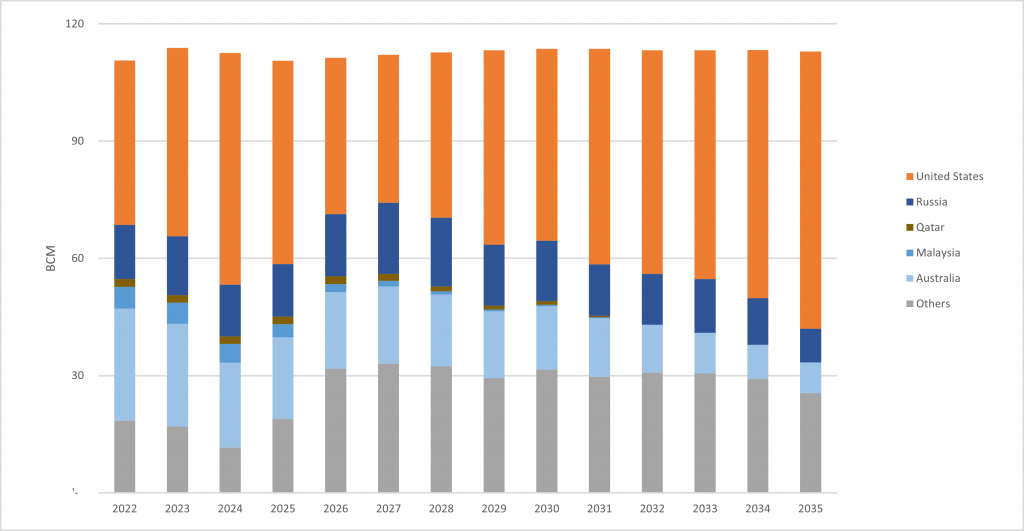
As the largest LNG importer until recently, Japan has always diversified supply sources. However, if today’s Japan employed an approach that only looked at cost, we estimate that half of its LNG imports would come from the U.S. (figure 1) Once our “Destination Constraints” are added to Japan’s purchasing model, imports from Russia and Australia gain greater prominence at the expense of the U.S. (figure 2)
Figure 1: Japan LNG Imports Under Base Demand without LNG Destination Constraints
 Figure 2: Japan LNG Imports Under Base Demand after Adding LNG Destination Constraints
Japan’s impact on Chinese LNG buying
Interestingly, as a result of Japan’s diversification strategy, U.S. producers have been incentivized to build bridges with other Asian buyers, such as China and India, and to sell in other parts of the world.
In just the last two years, the U.S. has rapidly increased deliveries to China. In 2019, only 0.5% of China’s LNG imports came from the U.S. In 2020, they were 5% and last year they grew to 12%. This plays counter to the political narrative between the two.
Were cost the only issue for China, then by 2035 our modeling shows that the main sources of supply would be Australia (21%), Malaysia (22%) and Qatar (22%), while the U.S. would only hold a small percentage of the market.
However, the recent flurry of long-term contracts signed by Chinese buyers with U.S. LNG suppliers indicate that China is also practicing a diversification rather than cost-based strategy. Last year, China’s CNOOC and ENN signed long-term contracts with American suppliers totaling 14 million tons of cargo per year. That’s nearly 50% of all LNG China signed contracts for during 2021. Improving trade relations indicate that the U.S. share of the Chinese LNG market is unlikely to fall below the 2021 level.
This same diversification strategy makes it possible to model which countries China is going to likely buy from going forward. Based on China’s destination constraint, there are greater opportunities for suppliers from nations outside of Australia, Malaysia and Qatar, which are currently the main LNG sellers to China. That includes space for more LNG imports from the U.S.
 Figure 3: China LNG Imports Under Base Demand with LNG Destination Constraints
What about decarbonization?
Two additional factors should be considered. The first is the potential impact of lower gas demand under a fast energy transition scenario.
In our “Base Demand” case, China’s gas demand grows at an annual average of 4% while Japan’s remains stable through 2035. In the “Advanced Technology” (fast energy transition) case, the average growth rate of Chinese gas consumption is 3%; Japanese gas consumption for power generation drops 3% per year.
For Japan, the latter fast-transition scenario would translate into lower import volumes and higher prices. In terms of supply sources, however, it would most affect LNG from the U.S. and Australia. Japanese buyers could find it difficult to justify long-term contracts with sellers in these countries if they felt uncertain about demand fundamentals.
The second assumption is about the impact from the proposed 50-billion-cubic-meter (bcm) PS2 pipeline from Russia to China. If it achieved FID and came online in 2030, it would provide China with an alternative to higher LNG imports.
The pipeline would likely have little impact on LNG imports to Japan due to growing demand from the emerging Southeast Asian market which could fill the gap left by China’s PS2 volumes. However, in China’s balanced portfolio approach, an active PS2 by 2030 is bad news for new volumes in U.S., Qatar and Malaysia looking for long-term contracts.
The cost calculation
To achieve the kind of energy security through diversification calculated above, countries would need to pay an economic cost. For Japan, under the Normal Demand scenario which also assumes an active PS2 pipeline in 2030, the cost of diversification could amount to a premium of about $0.04/MMBtu in the average settled price of LNG into Japan. This is equivalent to about $1.4 million per bcm.
In total, Japan’s annual LNG bill would go up by $150 million to retain and increase energy security by diversifying supply sources. This would amount to about 0.05% of the total cost of LNG supply, a small price to pay for a matter of national security. Meanwhile, the total annual premium for China, on average, would be around $270 million.
If Japan developed under the Advanced Technology scenario and faced decreasing gas demand, then the biggest impact would likely be on Australian and U.S. sellers, who would see their volumes decline. For China, the same scenario would spell smaller volumes for Qatar and the U.S., a trend that would be exacerbated by the PS2 project coming onstream.
The emergence of a truly global gas and LNG market makes it more important than ever to fully understand such relationships between domestic and global markets. This understanding is enhanced through market simulations to identify not only the risks but also the best opportunities during the energy transition.
About the authors
Dr. Robert Brooks is the Founder and CEO of RBAC, a supplier of global and regional gas and LNG market simulation systems used to support investment, M&A and improve operations.
Dr. Ning Lin is an energy industry economist and leader of the global gas and LNG modeling team at RBAC. Before joining RBAC, Dr. Lin managed global market analysis capabilities for Shell Trading, KOCH Industries and Tenaska.
Jiaxin Yang is a market research analyst with RBAC.
[1] Calculation details: 1 trillion = 10^6 million, 1 trillion btu = 0.029 BCM (according to BP), thus 1 MMBtu = 0.029 *10^(-6) BCM, thus 1 $/MMBtu = 1/(0.029 *10^(-6)) $/BCM = 34,000,000 $/BCM.
* In the results, Asian LNG price without LNG destination constraints is $0.04 lower than that with LNG destination constraints. Thus 0.04$/MMBtu = 1,400,000 $/BCM.
Japan LNG imports in 2030 = 110 BCM, cost = 110 * 1,400,000 = $ 0.15 billion
China LNG imports in 2030 = 190 BCM, cost = 190 * 1,400,000 = $ 0.27 billion)


