What Happens If the AEO 2025 Basic Assumptions Get Significantly Altered?
As energy planners and market participants look toward the future, long-term forecasts like the U.S. Energy Information Administration’s (EIA) Annual Energy Outlook (AEO) play a central role in shaping expectations and strategic planning. But what happens when the assumptions fundamental to those forecasts are vastly changed due to rapid shifts in the technology landscape, policy, and demand?
RBAC develops market simulation tools used by energy companies, utilities, and government agencies to analyze natural gas and LNG markets and explore how different scenarios could impact long-term supply, demand, and pricing. In this article, we examine the latest AEO 2025 in light of recent developments—including increase electricity demand growth driven by AI and data centers, and a changing federal policy landscape—then assess how those shifts could affect natural gas consumption in the U.S. power sector.
On April 15th the Energy Information Administration (EIA) published a new 2025 Annual Energy Outlook (AEO). The federal agency’s statutorily mandated report contains analysis and projections of energy consumption and supply trends within the U.S. through 2050.
Historically, RBAC had used the EIA AEO electric forecast to measure U.S. natural gas consumption for electric generation. When the EIA skipped its publication of the AEO in 2024 to perform model updates, RBAC started using a forecast derived from the North American Electric Reliability Corporation (NERC) to more accurately represent the rapid changes occurring in electricity generation; specifically, increasing demand from AI and data centers. EIA’s 2023 AEO incorporated a significant transition to renewable generation that has yet to materialize and did not consider load growth from data centers, though in fairness to EIA, this “new” demand only started showing up on the radar in 2024.
Below are some of RBAC’s thoughts about the various projections and how they may impact GPCM’s electricity gas demand outlooks.
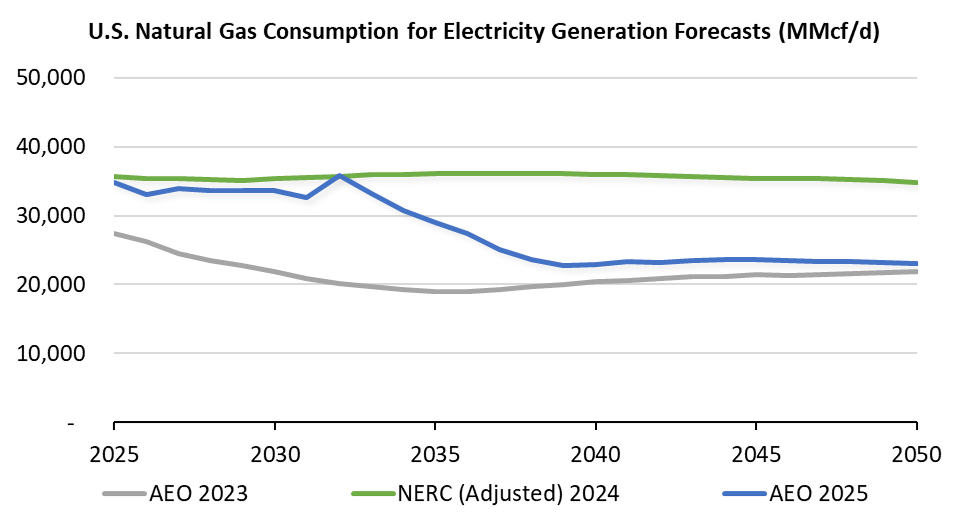
The AEO 2023 (gray line) projected a significant decline in natural gas consumption in the electric power sector starting in 2025, whereas the new 2025 AEO Reference Case (blue line) projects a steep decline starting in 2033 vs. The NERC 2024 forecast (green line) holds a very different view (more on that divergence below). EIA’s 2025 AEO Reference Case assumes U.S. natural gas consumption peaks in 2024 at 36.9 Bcf/d and remains near that level through 2032. Demand then peaks again between 2030 through 2033 at 35.8 Bcf/d, as natural gas consumption increases to compensate for declines in steam coal consumption for electricity generation due to continued retirements of coal plants. The AEO then projects natural gas consumption to decline by nearly 37% to reach 22.7 Bcf/d in 2039 and then remain at that level for the remainder of the forecast period. Remarkably, this level is almost identical to the AEO 2023 forecast.
Despite this decrease in natural gas consumption, the 2025 AEO projects U.S. total electricity generation to increase by 50% (from 4,418.96 terawatt hours (TWh) in 2025 to 6,646.17 TWh by 2050). So, if not natural gas, where is this increase in generation coming from?
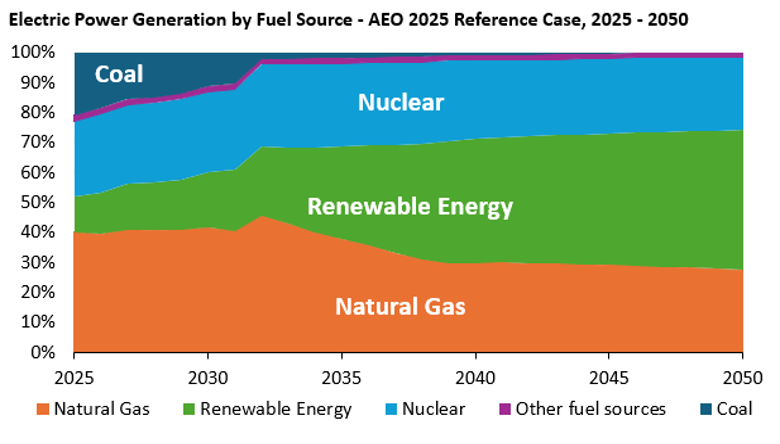
Contrasting the steep decline in natural gas consumption, the EIA projects aggressive growth in renewable generation following 2030. Renewables are expected to gain market share throughout the forecast and overtake natural gas as the primary electricity generation source by mid-2030s. Starting from 3.41 quadrillion BTUs (Quads) in 2024, renewables are forecast to grow to 14.8 quads in 2050, or at a 5.6% Compounded Annual Growth Rate (CAGR). Even though overall electricity generation demand is expected to grow, all other sources are expected to witness negative CAGRs. Unsurprisingly, coal is the hardest hit with a -18.4% CAGR, followed by distillate fuel oil at -4.7%, while natural gas sees a -1.7% CAGR.
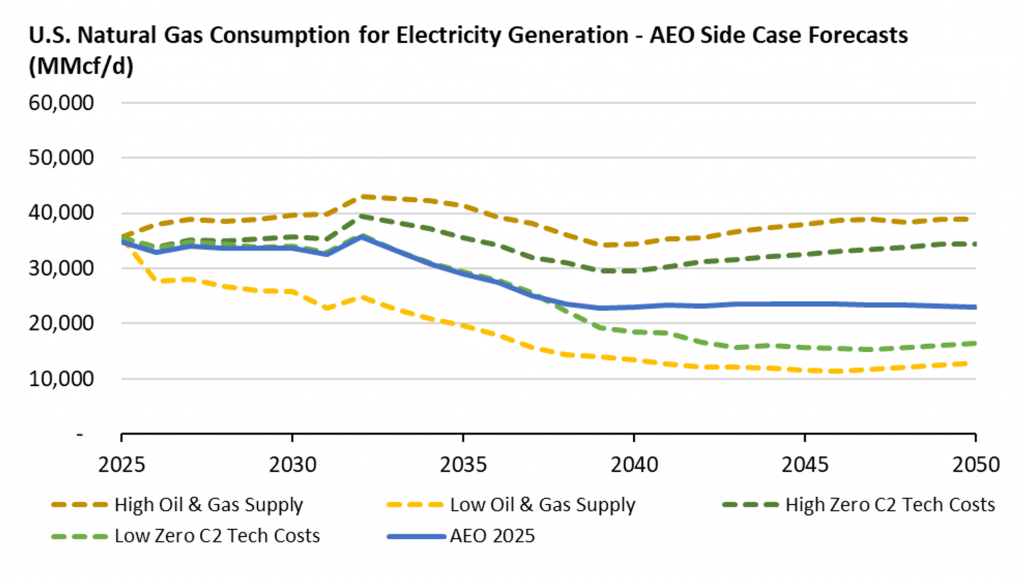
The 2025 AEO also provides 10 alternative cases, representing a range of outcomes for the U.S. energy system to model different policy and price environments. Some of these include providing projections for High or Low oil and gas supply cases (where recovery per well is assumed 50% higher or lower than the reference case, respectively). Similarly, their High or Low zero carbon technology costs cases test the “Overnight” cost, or the cost to build, operate and maintain a renewable plant (before adjusting for regional cost factors), is constant in the High case and declines by 40% in the Low Case.[1] As one might expect, natural gas consumption increases or decreases depending on the assumptions made in any of these side cases.
A major caveat for the AEO is it only considers laws and regulations implemented as of December 2024. That means their projections include assumptions like the impacts from the April 2024 Sect. 111(b) CAA rule finalization (which would require new baseload natural gas combustion turbines to operate with 90% CO2 capture by 2032 (AEO EMM Assumptions pg. 29)) and not the impact of April 3 “Liberation Day” tariffs or other changes in U.S. trade policy. Nor would this include any rollbacks or other policy changes implemented by the new Trump Administration, which is taking a less aggressive, perhaps more tempered and considered, approach toward environmental or climate policies.
In short, the world the AEO projects was guided by energy policies which have already undergone significant change—thus, the direction in which we are actually headed could be, or already is, vastly different given the current administration. Projections for renewable generation, for example, could be pushed back four years or more given the policy changes. According to a statement from the U.S. Department of Energy regarding its own AEO release, “today’s report from EIA reflects the disastrous path for American energy production under the Biden administration – a path that was soundly rejected by the American people last November.”(Statement from DOE).
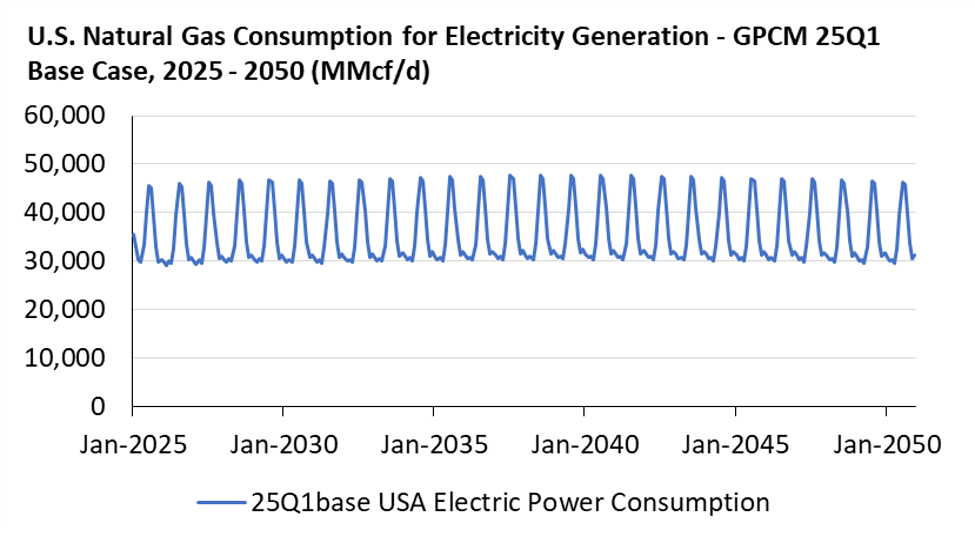
RBAC is continuing to use a modified NERC forecast in its 25Q1base release based on multiple factors including:
- Changes in the federal administration, which has taken a supportive stance towards traditional energy and is pushing to reduce regulation,
- Aggressive expectations and immediacy for power demand to meet AI and data center needs, and,
- Continued strong demand for current and new natural gas fired power generation.
Returning to Figure 1 and the adjusted view of NERC’s forecast, the vast gap of ~14 BCF/d is represents renewables and is the joker in the deck. There is no question that there is momentum behind increasing renewables in the energy mix across both the US and the world. Yet, for many reasons, from policy, to engineering to price, it is unclear if renewables will be able to dramatically displace natural gas, especially within the next 10 – 15 years as the 2025 AEO assumes.
But therein lies the power of RBAC’s simulation systems. Users can easily construct alternative scenarios that might include a more aggressive renewables displacement, or a more prolonged period of natural gas primacy, execute these scenarios and vet the varying outcomes. Using such features as “Make New Demand”, users can modify sectoral demand at aggregate (regional) or granular (state) levels and have a scenario ready for execution within minutes.
Would you like to find out more? Contact us now for a free demonstration.
RBAC, Inc. has been the leading provider of market fundamental analysis tools used by the energy industry and related government agencies for over two decades. The GPCM® Market Simulator for North American Gas and LNG™ is the most widely used natural gas market modeling system in North America. RBAC’s G2M2® Market Simulator for Global Gas and LNG™ has been instrumental in understanding evolving global gas and LNG dynamics and is vital in fully understanding the interrelationship between the North American and global gas markets.
[1] “Except as noted below, the overnight costs represent the estimated cost of building a plant before adjusting for regional cost factors”(EIA AEO2025 EMM Assumptions, pg. 10).