It may seem hard to imagine that almost one year ago, Covid-19 was just hitting newswires and was believed to be not much more of a concern than a tough flu season. Evidence of human-to-human transmission was just being established, and it would still be a few months before the World Health Organization (WHO) declared Covid-19 a pandemic (11Mar20).
An understatement of the year would be that a lot has changed since that time. Implementation of mandatory lockdowns of states and entire countries created an economic demand shock that led to catastrophic declines in global economic activity and thus energy prices. Supply chains were disrupted, and aggregate supply cratered. The impact of these events on the energy industry can easily be seen by the unprecedented drop in crude oil futures prices which went negative in April 2020 during the expiration of the May 2020 futures contract. It should also be noted here that a brief price war among the OPEC+ producers developed in March 2020 and was arguably the spark that ignited the price collapse flame, while Covid-19 was the gasoline accelerant – puns intended. The primary energy demand impact was felt in the transportation fuels sector as people drove and flew less; air travel effectively came to a standstill. Ethylene consumption, however, increased, as demand for plastics and other downstream derivatives strengthened.
Figure I. Petroleum Consumption Indexed to January 2020
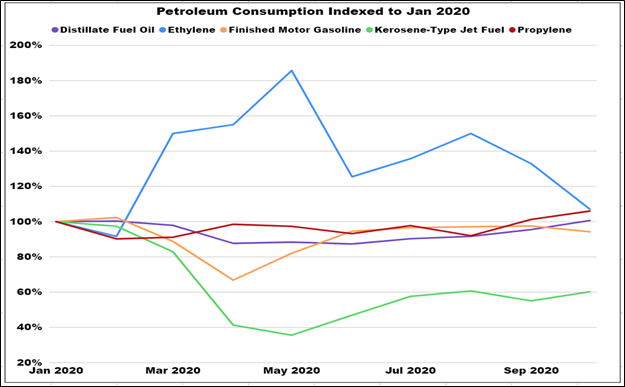
Source: Energy Information Administration
Both the human and economic tolls have been extraordinary, but fortunately vaccines have been developed with record breaking expediency and monetary and fiscal stimulus were quickly deployed. This rapid progress led to a faster rebound, in general, than initially anticipated, though some sectors, such as air travel, remains lackluster as can be seen from EIA’s jet fuel product supplied data.
Econ 101 teaches that the intersection of the supply and demand curves represents the market clearing equilibrium price, at a given point in time. Markets are constantly moving and thus this equilibrium price is constantly being adjusted to reflect changing supply and demand dynamics. When crude dropped below $0.00/barrel (Bbl), obviously it became uneconomic for many crude oil producers. Consequently, production shut-ins ensued, and supply declined.
Quick responses to throttle back supply by U.S. producers, OPEC+ rapidly coming to an agreement on production cuts, and both monetary (i.e., the Federal Reserve) and fiscal stimulus helped to buttress a sustained depression-like collapse in economic activity. One year on, equities markets are now at record highs, economic activity has rebounded (though still not back to “normal” levels whatever normal might be), and re-employment is outperforming expectations – albeit things are still well below trend. Lifestyle changes have occurred over the last year and many are expected to remain in place for the foreseeable future – e.g., more remote working and less traveling. This leads to shifts in energy consumption patterns and fuel type usage, but it is clear that demand has rallied, providing upward price pressure and a corresponding increase in supply.
In fact, natural gas prices have rallied back to the $2.50/MMBtu level (having briefly exceeded $3.00/MMBtu in late 2020), and crude oil prices are back over $50/Bbl. As a result, supply from areas such as the Permian basin are approaching pre-pandemic production levels and additional gas pipeline takeaway capacity has helped strengthen Waha basis prices. Similarly, production in gas-focused basins such as the Haynesville and Marcellus are also expected to reach pre-pandemic levels in 2021 and 2022, respectively. An important consideration going forward, though, are potential slowdowns of pipeline expansion projects due to what will likely be an increasingly stringent regulatory environment, especially for areas in the Northeast which includes the Marcellus and Utica shale plays. Examples of this more stringent regulatory environment include issues related to the Mountain Valley Pipeline and Dominion scuttling the Atlantic Coast Pipeline, as well as selling a large portion of their assets to Berkshire Hathaway. In just the last week, executive orders by the new administration have halted the Keystone Pipeline (crude oil) and put a 60-day moratorium on new oil and gas leases and drilling permits on federal lands. The potential for further regulatory tightening seems to be likely.
Beyond 2035, production economics should become more challenging as resource base depletion starts to impact production in areas like the Permian and increasingly stringent regulations hinder overall drilling and completions activity.
So, with global demand rebounding and supply more slowly climbing its way back, the stage for sustainable higher global gas prices appears to be set.
Old man winter finally came calling, providing colder than normal winter weather in Asia, in some cases historic, triggering a global gas price spike. Cold weather combined with a lack of international storage capacity resulted in JKM prices approaching $40/MMBtu. This has created an all-roads lead to Asia type situation, whereby any CH4 molecules (i.e., methane/natural gas) are seeking a pathway to Asia. Consequently, LNG vessel utilization has increased dramatically and delays transiting the Panama Canal have led to constraints triggering a sharp rally in spot LNG freight rates exceeding $300,000/day. Unsurprisingly, the “ARB” has been open for U.S. LNG exports to Asia for some time now, resulting in record exports of approximately 10 Bcf/d. In fact, vessel supply tightness has even caused potential cargo cancellations in February. The ARB outlook for the next several months, though, suggests strong U.S. LNG exports into the summer season.
Figure II. Gas Storage vs. Gas Consumption Ratio (as of 2020)
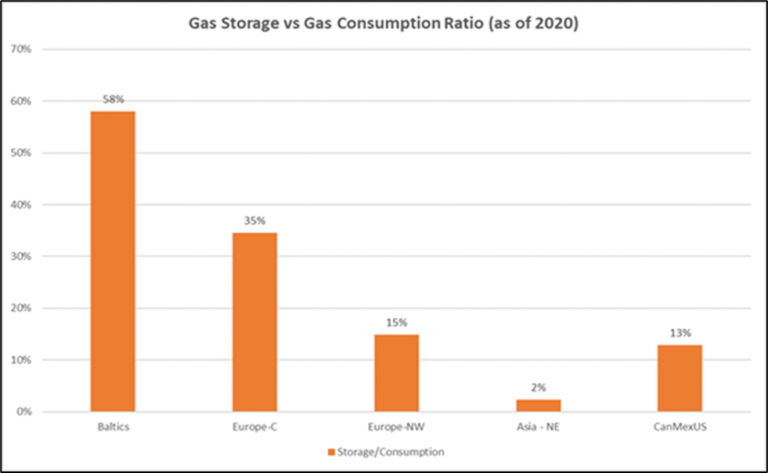
Even with U.S. LNG terminals operating at near capacity, the lack of cold winter weather domestically has pressured near-term Henry Hub prices to drop from over $3.00/MMBtu to approximately $2.50/MMBtu. The winter “degrees of freedom” are much less now than they were when RBAC’s 20Q3base outlook was released in December 2020. Concerns of End-of-Withdrawal-Season (WoWS) storage levels below 1.5 Tcf are all but off the table now, with expectations closer to the 1.65 – 1.8 Tcf range. The short-term focus now shifts to what End-of-Injection-Season (EoIS) storage levels will be and what is deemed adequate, especially when questions linger on production – will Year-on-Year (YoY) production realize declines, increases, or remain flat?
Such questions are relevant beyond the next winter season since they impact decisions related to project expansions, new brown or green field FIDs, potential mergers and acquisitions and overall portfolio risk management. But what appears to be the case specific to the Covid-19 pandemic is analogous to severe hangovers; time and prudency – along with plenty of liquids – is the cure.
RBAC’s GPCM® Natural Gas Market Forecasting SystemTM is designed to construct scenarios that address these questions. Our 20Q4base release incorporates the latest supply, demand, infrastructure, and tariffs data to produce our quarterly outlook, the highlights of which are summarized below.
RBAC’s 20Q4base forecasts a more rapid medium-term demand rebound than the 20Q3base, propelled by stronger electric power generation gas demand, primarily during the 2021 through 2035 period. This increased electric sector gas demand is driven by stronger Canadian demand, which is based on the Canada’s Energy Regulator forecast, and averages 0.7 Bcf/d higher than the 20Q3base. Conversely, the U.S. gas demand for electric power generation forecast obtained from the EIA averages slightly lower at 0.1 Bcf/d through 2035 before the deficit gap widens and approaches 1.0 Bcf/d due to significantly higher gas prices. Mexico gas for power demand is obtained from the SENER. In 20Q4base, this demand averages about 0.8 Bcf/d lower through the forecast period with the main driver being the 2035+ period when gas prices are rising, further reducing gas demand for power generation. In general, with the strong environmental push for greener power generation, the outlook for gas demand, especially beyond 2035, becomes more tenuous.
Industrial demand continues to rebound more strongly than anticipated. Leading/contemporaneous indicators like the Chemical Activity Barometer continue to increase – signifying positive future Industrial Production metrics. As such, 2020 industrial gas demand is approximately 0.4 Bcf/d higher in the 20Q4base for all North America, driven by U.S. demand. The forecast is essentially flat to the 20Q3base for 2021 before slight deficits begin which grow to approximately 0.5 Bcf/d in 2030, 1.0 Bcf/d in 2040 and approaching 2.0 Bcf/d by 2050. The primary reason for this deficit is lower Mexico industrial gas demand which is being impacted by higher gas prices resulting from a more than 6.0 Bcf/d lower overall North America production level by 2050, relative to the 20Q3base – see supply discussion below for details.
Figure III. Chemical Activity Barometer vs. Industrial Production Index
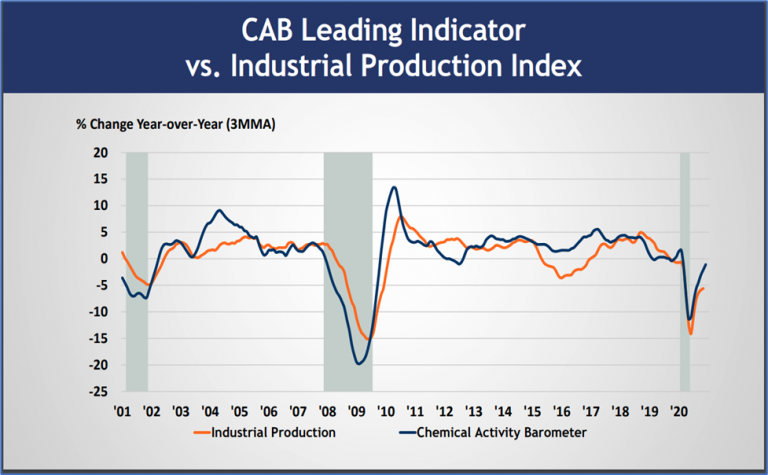
https://www.americanchemistry.com/Jobs/CAB/short-term-1.pdf
The current trends of shifting demand from commercial to residential may continue for at least the balance of 2021, as remote working remains in place while vaccinations are administered. It will take some time before enough inoculations allow for re-opening workspaces and the ability of employees to congregate in tighter, more densely populated spaces. The 20Q4base sees flat to marginally lower RES+COM demand through late 2030s before higher gas prices start to negatively impact demand, albeit the average deficit is marginal at just over 0.1 Bcf/d.
Figure IV. North American Natural Gas Consumption (MMcf/d)
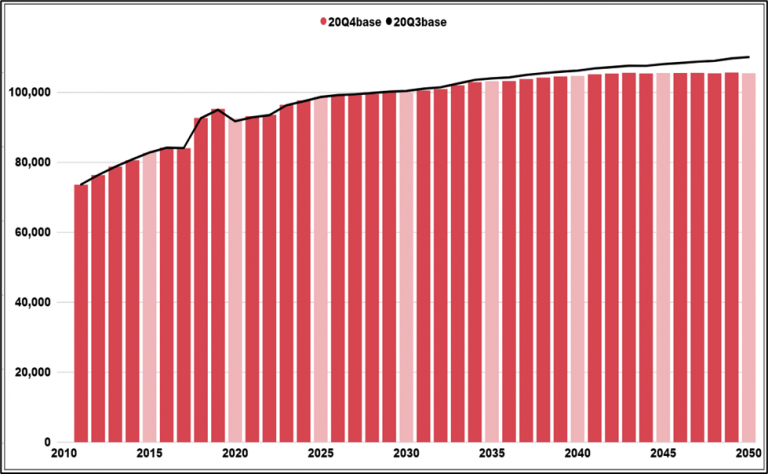
Source: GPCM
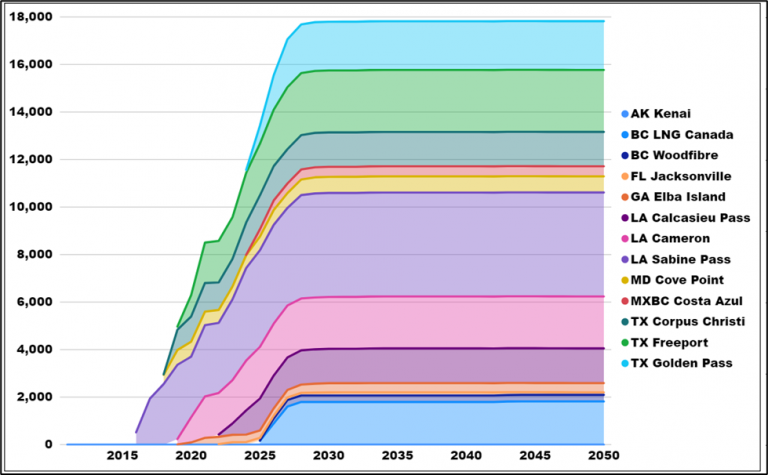
LNG is becoming an increasingly important component of the supply and demand balancing equation for the U.S. natural gas market. Current record LNG exports are expected to moderate somewhat as the Northern Hemisphere exits the winter demand season but are projected to remain elevated, especially when compared to previous year send outs. With global demand rebounding stronger than anticipated, 20Q4base forecasts U.S. LNG exports to hold at or above the 8.5 Bcf/d level throughout 2021 and 2022, then accelerating in 2023 and beyond, before plateauing just under 18.0 Bcf/d. This top-end level is lower than 20Q3base maximum (and previous quarterly releases) which exceeded 19.0 Bcf/d. This lower peak is directly attributed to turning off the Driftwood LNG Terminal from the 20Q4base outlook due to the project’s inability to attain long-term Supply Purchase Agreements (SPAs) which are deemed necessary to ensure financing and Final Investment Decisions (FIDs). This has led to delays and/or shelving of pipeline project(s) to feed the terminal. In addition to existing Gulf export facilities absorbing flows that were previously destined for Driftwood, the newly FID’d project on the Baja coast of Mexico, Costa Azul LNG, has been turned on in 20Q4base.
Figure V. LNG Exports (MMcf/d)
Source: GPCM
As discussed above, prices have increased significantly over the latter half of 2020 as demand rebounded and production curtailments by both U.S. producers and OPEC+ tightened the supply/demand balance. U.S. producers responded by re-opening some shut-in production and making greater use of Drilled-but-Uncompleted (DuCs) wells which are less expensive to bring online than drilling and completing new wells. The 20Q4base forecast predicts supply to increase during 2021 as production continues to ramp up, especially in areas near the majority of LNG export capacity which exists along the U.S. Gulf Coast. This ramp is further supported by crude oil prices exceeding $50/Bbl and new gas pipeline takeaway capacity, via the Permian Highway Pipeline, that is helping to evacuate gas from the Permian basin, where dry gas is effectively a by-product of crude oil production. The challenge for Permian basin production will be the resource base potential and heightened regulatory issues which are starting to appear. In particular, the new administration has just implemented a 60-day moratorium on federal land leasing and drilling. This will impact a large portion of New Mexico where a sizeable portion of the Permian basin resides. Additionally, areas of Colorado, Wyoming and other significant oil and gas producing states will be impacted. This raises the likelihood that either extensions of this moratorium, or additional prohibitive regulatory actions will be forthcoming. The 20Q4base release takes these issues into consideration, which impacts some basins; the Permian being one, resulting in a lower production forecast vs the 20Q3base. This is the main driver of the higher price forecast that starts to materialize in the 2035+ period.
Similarly, Eagle Ford is seeing increased activity and production gains due to the more favorable crude oil price and its proximity to new LNG export capabilities in the Corpus Christi area.
Although rig activity is still well below the peaks in all the major basins, the declines have reversed, and rig activity is increasing in the Permian, Eagle Ford, Haynesville, and Marcellus – green dots in Figure VI below represent peak counts while red represent the lows.
Figure VI. Baker Hughes Rig Count by Basin (3Aug18 through 22Jan21)
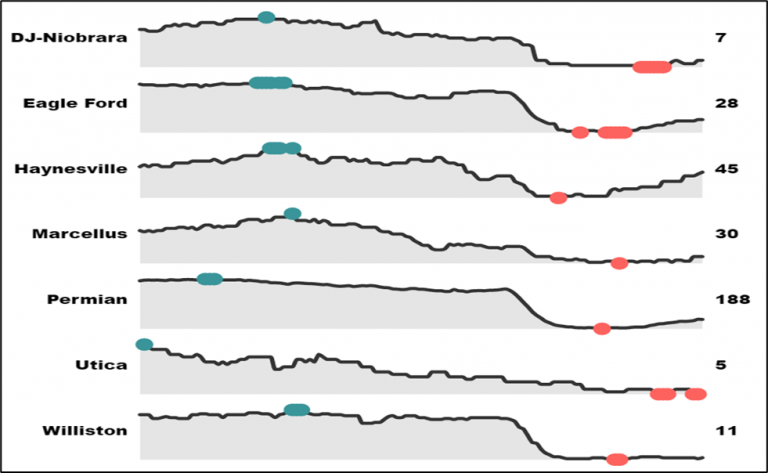
Source: Baker Hughes, RBAC
Gas centric plays such as the Haynesville and Marcellus are still a major focus for producers as break-even economics continue to improve. The Haynesville is in a particularly favorable proximity position to LNG export terminals and is expected to see continued growth throughout the 20Q4base forecast. Likewise, the Marcellus resource base is very robust, but the challenge in the Appalachia region will be the ability to find expanded takeaway pipeline capacity to allow for significant production increases. Recent events do not bode well for this region as one need only consider the continued delays and issues facing the Mountain Valley Pipeline and Dominion’s decision to scuttle the Atlantic Coast Pipeline – even after having sunk billions of dollars into the project – as well as selling off a large portion of their assets to Warren Buffett’s Berkshire company. As such, the 20Q4 release excludes the Mountain Valley Pipeline, and the forecast is for more limited Marcellus growth than the 20Q3base release.
Figure VII. North American Dry Gas Production (MMcf/d)
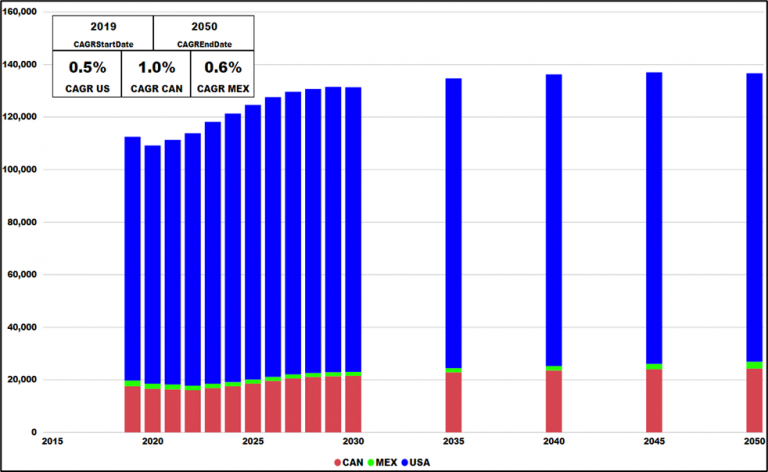
Source: GPCM
Winter heating season has now entered the back half of the period. Given the mild winter season to date, Henry Hub prices have receded from the $3.00/MMBtu level seen in late 2020, and prices are currently near $2.50/MMBtu. The 20Q4base expects price appreciation during the summer months as power generation demand starts to ramp up and storage demand, i.e., injections, start to take effect. Henry Hub prices are expected to average $3.00/MMBtu in 2021, moving higher to $3.30/MMBtu in 2022 before pulling back into the $2.60 – $2.80/MMBtu range from 2024 through 2032. By 2036, average prices have again breached the $3.00/MMBtu level and continue to move higher as increased regulatory issues and resource base economics become more difficult.
Basis markets in the primary supply areas will remain challenged over the long haul, in particular AECO and Dominion South see continued deteriorating basis markets – notwithstanding some short-term strength for AECO, specifically through 2023. This early strength is also seen at the WAHA hub as new pipeline capacity comes online, i.e., Permian Highway, which helps boost basis prices back toward the minus teens level. However, as production continues to ramp in the Permian basin, congestion starts to set in again, though not as extreme as experienced in recent history, pressuring basis back toward the -1.00/MMBtu level in 2042. Thereafter, basis starts to strengthen again through the forecast balance as supply starts to tighten.
Figure VIII. Henry Hub Price and Basis Map (Real 2020 US$/MMbtu)
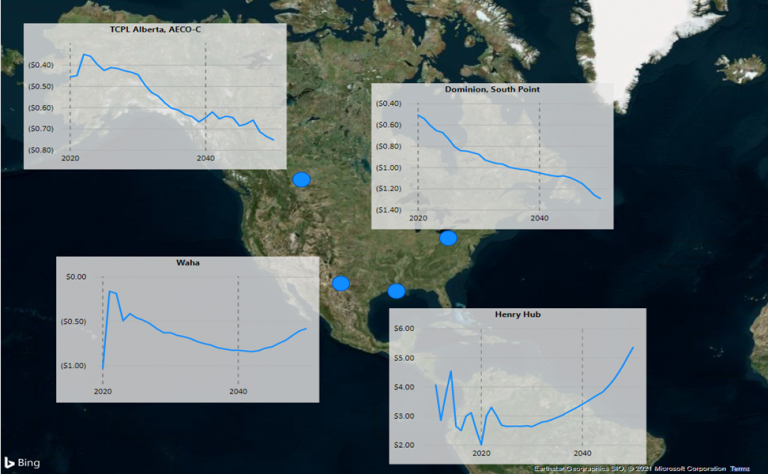
Source: GPCM
One year on from our first inkling of a pandemic event and the energy markets have rebounded quite nicely, if not surprisingly fast. There are new challenges on the horizon, though, and potentially right around the corner. Be it a potential new regulatory regime or a heightened focus and significant financial investment in greener technologies – such as hydrogen, renewable gas, and electric vehicles. Numerous factors and influences are currently at play modifying and possibly enhancing risk. RBAC’s 20Q4base captures a perspective of some of these new risks, but more importantly serves as a baseline from which a wide array of alternative scenarios can be constructed, executed, compared, and evaluated. Such processes lead to better identification of potential risk and optimal decision making.
RBAC’s GPCM® Natural Gas Market Forecasting System™ is used to produce RBAC’s quarterly natural gas outlooks. GPCM’s robust modeling capabilities are well suited for simulating market conditions during the “interesting times” that the energy industry is currently experiencing. Users have enormous flexibility in modifying supply, demand, and infrastructure assumptions to help assess market risk and opportunities, thus leading to better informed and more optimal decisions.