In Parts 1 and 2, we explored how pipelines and markets evolved from regulation to competition. In Part 3, we examine how the market evolved from 1997 to the market we know today, beginning with how participants tried to forecast and plan within a system that had become too complex to see all at once.
Section 8 — How Market Participants Tried to See the Future
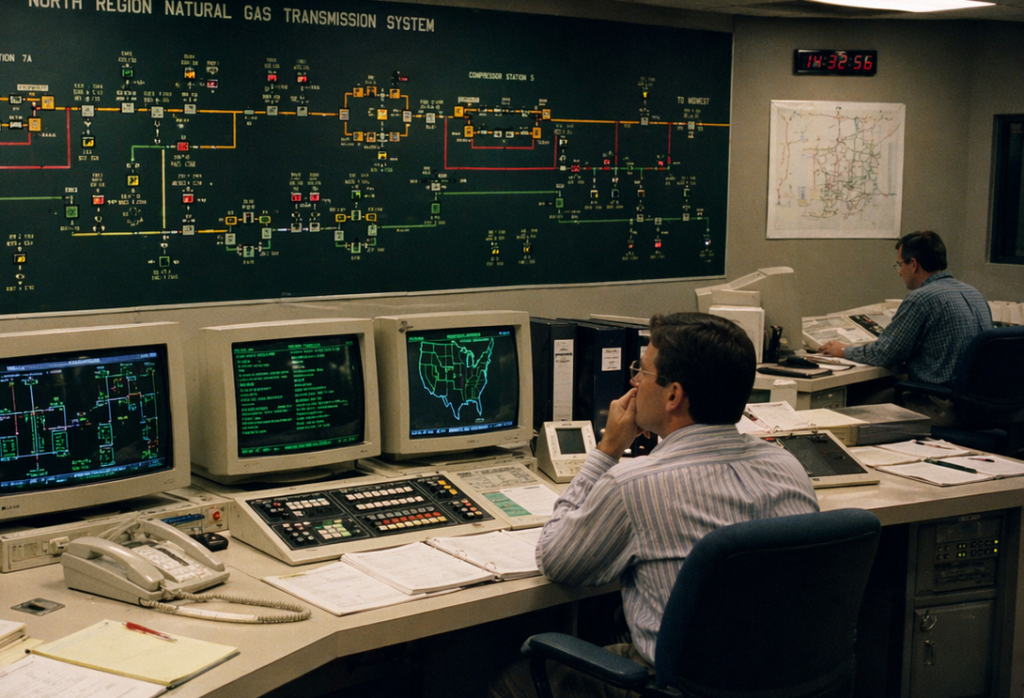
Long before full‑market simulation, producers, utilities, and pipelines made costly, forward‑looking decisions by relying on contracts, experience, and increasingly analytical tools to anticipate how the market might evolve.
Localized Solutions for Future Risk
Utilities used spreadsheets for Least Cost Planning: laying out winter‑peak balances and stress‑testing weather scenarios to ensure reliability. But these plans typically treated market price as a fixed “input,” not a dynamic outcome shaped by their own actions or by neighboring utilities.
Pipeline analysts used localized linear programming (finding the best outcome from a set of choices within constraints) to optimize the physics of a single system: testing how much gas the pipe could move under different operating conditions and how that affected throughput and tariff revenue. These models could not predict how a new pipe three states away might “steal” market share.
Traders relied on desk‑level analysis—quick, ad‑hoc calculations built from price history, pipeline bulletins, and weather data to estimate basis and spreads. These “quick‑and‑dirty” tools depended on historical correlations that broke down as market complexity increased.
Producers assembled manual scenario decks—structured planning documents combining long‑term price forecasts, transport options, and basin‑to‑market netbacks—to justify drilling CAPEX or long‑term transport commitments. These decks relied on netbacks: subtracting fixed transport costs from a guessed market price across dozens of slides.
Each decision was made well on its own terms, but they remained local solutions to a much larger problem:
How do you simultaneously solve supply, transportation, storage, timing, and competing‑corridor economics at continental scale? (system‑wide market clearing)
Because:
- A utility’s best supply plan depended on future spot prices.
- Those prices depended on how gas flowed through the system.
- Flows depended on available transportation.
- Transportation depended on which pipelines were built or expanded.
- And pipeline economics depended on how producers, utilities, and traders responded to those same price signals.
No decision lived in isolation.
When the spreadsheet ceiling was reached
Before full deregulation, prices were regulated, flows were allocated, and arbitrage was limited, so local tools were generally sufficient for local decisions. As deregulation unfolded, the market became competitive, faster‑moving, and interconnected: prices, flows, storage, and capacity began influencing one another across the continent.
By this point, older tools could not capture how thousands of separate decisions interacted and reshaped the system at once. Outcomes became path dependent: who acted first, how others responded, and how those reactions fed back into prices and flows.
Before 1978, decisions unfolded slowly. By 1997, decisions were made daily, with impacts felt immediately, seasonally, and years ahead. The path the market took (decisions not pipeline routes) began to matter as much as supply, demand, or cost.
A pipeline expansion (such as looping or added compression) that looked obvious on paper could still fail to clear enough incremental volume once the market began reacting. Competing projects might reach the market first, storage could absorb gas seasonally, basis could narrow as supply or capacity shifted elsewhere, alternative paths could grow more competitive, or demand might emerge in different regions or seasons than expected. In each case, market responses could erode flows and undermine the project’s economics.
None of these outcomes reflected bad assumptions or poor analysis. Rather, other market participants responded to evolving prices, constraints, and opportunities, and their forward‑looking decisions reshaped the system. As the market continuously rebalanced at a systemwide level, projects that once looked “obvious” from a local or regional view could see their project economics fundamentally change.
Analogy of a Game
By 1997, each market player could optimize their own move, but no one could see how all moves, taken together, reshaped the full board.
As an analogy, imagine a strategy game (think Risk or EVE online) where you must make decisions on an incomplete map that reveals itself only over time. But other players who are also competing for the same resources, are also making their own decisions elsewhere on the map. As the game progresses, the effects of those unseen decisions gradually emerge, sometimes reinforcing your strategy, sometimes undermining it, even when every player acted rationally based on the information available at the time.
In much the same way, the natural gas market evolves through the interaction of independent, forward‑looking decisions, with their combined effects becoming visible only as prices, flows, and constraints adjust toward a new market equilibrium.
What solved the many-decisions-at-once problem?
Section 9 — Gas Pipeline Competition Model (GPCM)
The year was 1997 and the North American gas market had become too interconnected to view it through one region, one pipeline, or one spreadsheet at a time. The industry was clamoring for a solution that took into account the possible decisions across the entire market.
How could supply and demand balance across different locations connected by some kind of network? In economics, this is called spatial equilibrium: optimizing the flows and regional prices that create the greatest total economic benefit, with the condition that gas only moves when the price difference equals (or exceeds) the cost of moving it.
And since we’re talking about all the many decisions at the same time, how do we get the whole market balancing supply, demand, transport, storage, and timing all at once: full-system market clearing.
Or in real terms: gas production in Texas, storage in West Virginia, winter demand in New Jersey, and pipeline congestion in Appalachia all had to be solved as one connected puzzle.
- supply
- transportation
- storage
- seasonal timing
- and every location price (basis—and at spatial equilibrium)
The breakthrough was treating the market as a pipeline-specific network model rather than a collection of disconnected local decisions.
Picture an Uber‑style app coordinating every rider and driver during a typically chaotic New York City Saturday night, with fares, traffic, and routes all adjusting at once. Now replace riders and drivers with molecules, pipelines, contracts, storage, and price signals, and that’s how the North American gas market moves together. The model asks:
At what prices and flow paths does the entire network reach economic equilibrium (no producer, shipper, or buyer can improve their outcome by rerouting gas, rearranging storage, or changing contracts given current prices)?
That was GPCM, and that was the turning point.
For the first time, participants could see how the market rebalanced as a single connected system. A supply shift in one basin could be traced through congestion, basis, storage behavior, seasonal spreads, and even future drilling attractiveness. Pipeline expansions could be tested against how new capacity might interact with the rest of the grid: would it be displacing flows elsewhere? be dampened by storage? or collapse price signals before filling?
Earlier models may have asked,
“Is this pipeline’s tariff less than the observed price spread?” (or “Is the price difference right now between these two locations big enough to pay for the pipe?”)
GPCM asked the richer question:
“If this pipeline is built, how will other pipelines, storage operators, and producers respond—and will the spread that justified the project still exist afterwards?
What distinguished GPCM’s approach from earlier gas models was that pipelines were not treated as neutral conduits, but as competing corridors within a constrained network. Capacity additions could not simply “serve demand,” but they rather competed with existing routes for flows, revenues, and long‑term market share.
That distinction allowed analysts to separate projects that truly enabled additional gas from those that primarily displaced existing flows. A new pipeline could just pull gas away from other pipelines rather than add demand or production, and possibly shrink or eliminate the basis that originally made the project look attractive. Rather than simply a question of whether a single price spread exceeded a tariff, pipeline economics became who gains flows, who loses them, and how those shifts would play out over time as the market adjusted.
Just as important, regulatory approvals, tariff structures, and long‑term contracts determined not only whether a pipeline could be built, but whether it would continue attracting gas once the market adjusted; that is, which pipelines succeeded and which struggled.
Because pipelines operated under open access, and because hedging and basis trading allowed market participants to react quickly, these competitive outcomes often appeared faster than in earlier periods. Prices and flows shifted not only when pipelines entered service, but as soon as projects were announced, contracts were signed, or rates changed. As a result, basis narrowing, rerouted flows, and underutilization could show up before a pipeline went into service, reducing actual volumes and returns compared with initial expectations.
That shift—from isolated project logic to systemwide response—was the real leap forward. While GPCM established the benchmark for full system market clearing and laid the framework for market simulation in 1997, its most “heroic” era was yet to come.
Section 10 — The Modern Era (1997 – Present)
The Shale Revolution
The story of the Shale Revolution is pivotal not just for natural gas, but for oil and even geothermal today. I wrote a fuller version of this story which you can read if you would like more detail, but below is the summary in relation to the gas market and building pipelines.
By the late 1990s, the North American natural gas market had finally learned how to clear across supply, transportation, location, storage, and time—but no one predicted how dramatically the map itself was about to change.
Most analysts at the time believed U.S. gas production was in long-term decline. Infrastructure planning reflected that assumption: LNG terminals were permitted and built for imports; pipelines were oriented to move gas from the Gulf Coast toward consuming regions, and forecasts centered on managing scarcity rather than abundance.
That view began to “fracture” in the early 2000s, when large‑scale shale gas production became commercially viable—first in the Barnett Shale, with success copied in early non‑Texas plays like the Fayetteville and Woodford shales. The breakthrough was the technological trifecta of horizontal drilling, hydraulic fracturing, and greatly enhanced subsurface imaging. Production grew stepwise at first, then accelerated as techniques improved and costs fell. By the mid-2000s, rising gas prices reinforced development, bringing new basins into play and expanding drilling far beyond early test cases.
From 2008 onward, the structural shift was unmistakable. Productivity gains accelerated, supply became highly responsive to price signals, and thousands of miles of pipeline were added in rapid succession. Natural gas displaced coal across the power sector. Industrial demand rebounded. Petrochemical and fertilizer projects returned to the Gulf Coast, attracted by abundant low-cost feedgas. Gas-fired power plants became more competitive in regions where coal had long dominated.
But prices collapsed—averaging below $3/MMBtu by 2012.
It was not because demand weakened. It was because shale output expanded faster than regional takeaway could be built. Producers learned that shale was never merely about supply. It was about deliverability. Where production outpaced pipeline capacity, gas backed up locally, basis weakened, flaring risk rose, and drilling growth slowed.
Where new takeaway unlocked constrained supply, flows ramped quickly, regional prices firmed, and the system faced entirely new congestion and reliability stresses as markets adjusted.
This period also exposed the limits of traditional forecasting. Appalachian production did not merely add volume—it forced reversals in long-established flow patterns. Pipelines designed for south-to-north transport began moving gas north-to-south. Compressor stations and interconnect economics had to be rethought. Storage economics shifted as producing regions became more directly connected to winter demand centers. Even winter price risk changed. Instead of scarcity being centered mainly in distant consuming regions, localized deliverability risks now began appearing closer to fast-growing production basins, power corridors, and newly constrained citygates.
What had once been a Gulf-to-market system was becoming a multi-basin, bidirectional network. And LNG terminals once planned for imports were quietly re-evaluated as potential export assets.
By 2016, when the first Lower 48 LNG export cargo departed, the transition was complete. What began as a domestic supply innovation had become a systemwide transformation, turning the United States from an expected gas importer into a fast-expanding exporter. But the domestic legacy was just as important: shale rewired pipeline direction, power economics, industrial geography, and regional reliability risk across the continent.
And only then did pipeline economics begin to be shaped not just by domestic demand, but by the emerging logic of global gas arbitrage—in a market beginning to coalesce much like the North American story you’ve read so far.
Globalization (2016–present)
In 2016, the United States crossed a line that permanently linked domestic pipeline economics to global pricing and geopolitics. The first LNG cargo from the Lower 48 left Sabine Pass on February 24, 2016.
Afterwards, U.S. LNG exports rose from 0.5 Bcf/d in 2016 to 15.0 Bcf/d in 2025, with EIA projecting volumes above 18.6 Bcf/d by 2027.

That is not a side business. That is load-bearing demand, and the scale and direction of pipeline expansions prove it.
In 2025 alone, U.S. pipeline expansions added about 6.3 Bcf/d of new capacity, and 85% of that buildout was aimed at the South Central region, primarily the Gulf Coast LNG corridor.
Two Louisiana intrastate projects by themselves added roughly 3.5 Bcf/d, moving Haynesville gas toward the Gillis Hub and into liquefaction-linked corridors feeding projects like Plaquemines LNG.
The story is more than “the Gulf Coast is building pipes,” but rather, “global demand is now directly shaping domestic pipeline corridors.”
Even when the pipe is entirely inside Louisiana or Texas, the demand signal may originate in Europe’s storage needs, Asian industrial growth, or global shipping disruptions.
That’s a global market. And the physical pipe may still be domestic, or even intrastate.
But the economics increasingly clearing against international arbitrage: where cargoes are most valuable, where storage is tight, and where regasification demand is rising.
This is also where Dr. Robert Brooks’ long modeling legacy naturally extended into the next layer. If GPCM helped the industry understand how the North American market clears as one constrained system, the next question became unavoidable:
How does the world clear when North American LNG competes with Europe, Asia, and the Middle East at the same time?
That is the logic behind G2M2 Market Simulator for Global Gas and LNG, developed as the world began moving toward a truly interconnected gas market.
The same market-clearing principles still apply: supply, transportation, storage, and timing all must balance.
But now the network includes:
- liquefaction terminals
- LNG shipping routes
- regasification terminals
- European storage inventories
- Asian power and industrial demand
- geopolitical risk
- competing global supply expansions
In other words, the North American story did not simply mature with GPCM and Shale, but these became part of the greater story of a global gas market now clearing across continents instead of just corridors.
And once that happened, domestic pipeline expansions were no longer driven only by local basis or regional scarcity, but they increasingly became responses to global demand pulls, international price spreads, and geopolitical risk.
And that feedback loop going out to the global market and back to North America, was about to get a new demand pull.
AI / Data Centers – New Demand, New Future
For a long time, U.S. electricity demand growth was—frankly—boring. For nearly two decades, efficiency gains and broader economic shifts kept total power demand almost flat, even as population and GDP continued rising.
Then boring ended.
The first visible wave came from crypto mining, which taught grid planners a hard lesson:
large loads can appear quickly, migrate unexpectedly, and create intense local stress.
But the larger and more durable shift is now coming from AI and data centers.
Data centers are built primarily where there is access to reliable power, which can mean 99.999% or in other words, no more than 5 minutes of downtime. And power loads can go from a few megawatts to gigawatt loads.
Recent DOE and Berkeley Lab work estimates data centers consumed about 4.4% of total U.S. electricity in 2023, up from 58 TWh in 2014 to 176 TWh in 2023, with projections reaching 325–580 TWh by 2028. That could mean 6.7% to 12% of all U.S. electricity demand.
But it is not simply “more power demand,” but it is highly concentrated localized power demand. And that means natural gas fueled power demand will not rise evenly across the country. It will rise where:
- new gas-fired generation is built
- older gas units are kept online longer
- power markets need fast-response reliability
- and pipeline deliverability exists on peak days
We are already seeing this in places like Virginia’s data-center corridor, the Permian Basin’s new gas-fired power buildout, and fast-growing industrial regions where electricity demand is beginning to scale faster than local infrastructure was originally designed to handle.
This creates a new competitive layer in the market.
The same molecules may now be pulled in multiple directions at once:
- inland power demand
- Gulf Coast LNG export growth
- industrial electrification
- local winter reliability
- associated gas volatility from oil prices and drilling
- and regional data-center clusters
In basins like the Permian, this can create a familiar oscillation:
- local glut where associated gas outpaces the pipes and crashes prices (basis blowouts),[5]
- and infrastructure deficit where new power and pipeline projects struggle to catch up with localized demand pull from AI and LNG.
And data center developers are choosing natural gas with the surge in on-site gas generation, as well as increased new builds and delayed retirements of gas-fired power generation.
The next era of pipeline economics will likely be defined less by national supply totals and more by regional constraints, timing, power-market deliverability, and competition between domestic load growth and global LNG demand.
In many ways, this is the next version of the same puzzle Dr. Brooks first modeled in the shortage era: not just how much gas exists, but whether it can reach the right place at the right time under real-world constraints.
FINAL CONCLUSION
What the Data Shows About Building Pipelines
By the time you’ve walked from 1891 to AI-driven data centers, the pipeline story becomes crystal clear.
Pipelines aren’t built simply because someone wants them.
They are built when demand exists, prices support it, infrastructure allows it, contracts finance it, and regulators (and the public) permit it, all at the same time.
When even one of those legs wobbles, the outcome is not just a short delay. Instead, the market finds another way to clear:
- basis blows out
- storage economics shift
- demand gets reduced
- fuel switching accelerates
- LNG cargoes pull molecules elsewhere
- or regional reliability risk rises
Pipelines are not really “projects”; they are market outcomes. Pipeline infrastructure is endogenous, emerging through feedback loops across the network. Basis, spreads, and flow patterns don’t just result from pipelines—they determine whether pipelines get built in the first place. Actual pipe appears in the ground only when economics, contracts, and system constraints align strongly enough to justify it.
So, that is the real answer to the question this series began with: What does the data show us about building natural gas pipelines?
The logic that began with Dr. Brooks’ GASNET during the shortage era carries straight through to today:
- GASNET: introduced network‑level spatial equilibrium for the U.S. gas system under regulation.
- GPCM: extended that logic to a competitive North American market, with endogenous flow competition across pipelines, storage, and basis.
- G2M2: extended it again to global gas and LNG, where shipping costs and regasification capacity become the dominant spatial constraints.
The market clears as a connected network, not as isolated bilateral deals.
Pipelines are the physical manifestation of that market logic.
And today, the market can no longer be understood in silos. Whether the challenge is a constrained basin, a Gulf Coast LNG corridor, a Virginia data-center cluster, or global LNG arbitrage, the same question remains:
Can gas reach the right place, at the right time, at a price the market will clear?
In an era where “boring” demand has been replaced by a high-stakes regional and global chess match, having the tools to simulate those interacting moves months, or even years ahead, is not a “nice to have.”
It is how the next pipeline gets built, the next hedge gets placed, the next LNG cargo gets priced, or the next major deal gets made.
RBAC, Inc. has been the leading provider of market fundamental analysis tools used by the energy industry and related government agencies for over two decades. The GPCM® Market Simulator for North American Gas and LNG™ is the most widely used natural gas market modeling system in North America. RBAC’s G2M2® Market Simulator for Global Gas and LNG™ has been instrumental in understanding evolving global gas and LNG dynamics and is vital in fully understanding the interrelationship between the North American and global gas markets.