In RBAC’s article published in April 2021 (https://rbac.com/chinas-lng-imports-outlook-can-the-united-states-capture-more/), RBAC’s global gas team analyzed China’s LNG imports market and predicted that the United States would play an increasingly important role in China. Nearly one year has passed and we have seen both the United States capture more market share as well as China’s LNG imports surpass Japan’s for the first time.
China’s imports of LNG for 2021 reached a record 79.6 million tons, around 19% growth over the previous year, according to the customs data. Meanwhile, Japan’s imports of LNG fell to 74.3 million tons, giving up the world’s largest buyer spot.
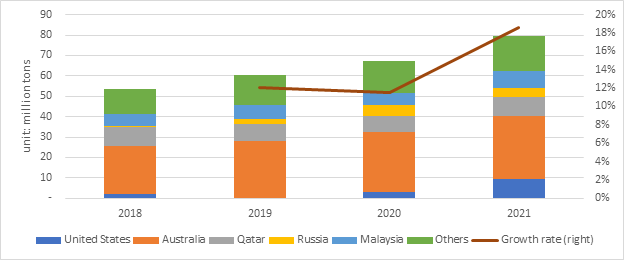
Figure 1: China Annual LNG Imports by Origin
When LNG from Australia and Qatar accounts for nearly half of total LNG imports, US LNG is playing a more important role in the Chinese LNG market. After the tariff was cancelled in March 2020, the amount of LNG from United States into China increased from 3.2 million tons in 2020 to 9.2 million tons in 2021 and the share of US LNG of total China LNG imports is increased from 5% to 12%.
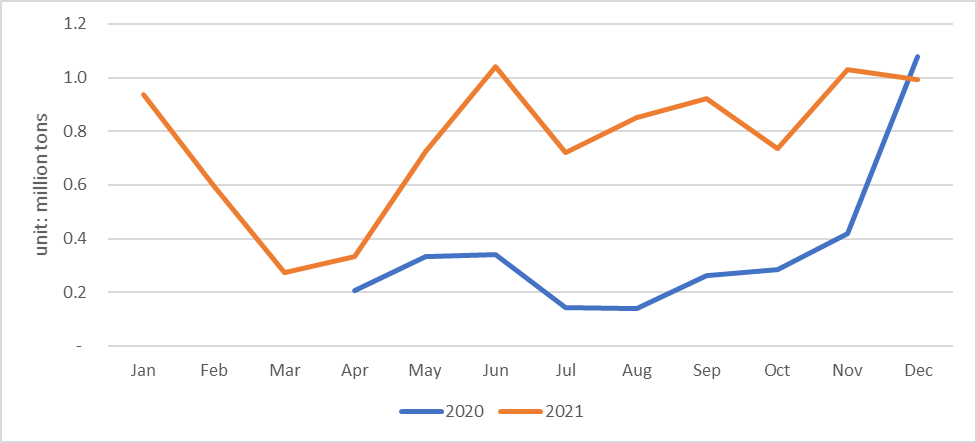
Figure 2: US LNG Flow into China
LNG is usually considered as an alternative to pipe gas. However, both LNG and pipeline imports into China grow 19% and 23% respectively last year.
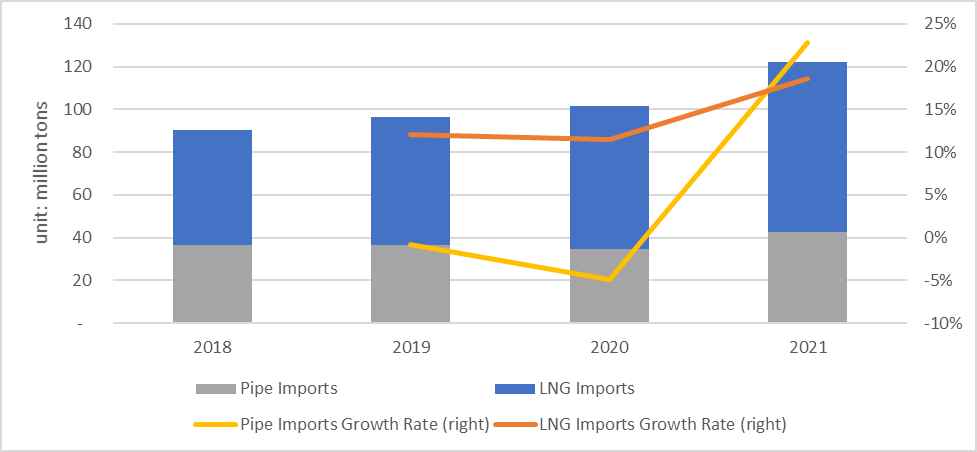
Figure 3: Volume and Growth Rate of China’s Pipe and LNG Imports
Pipe gas from Russia shares the fastest growth rate, increasing from 3 million tons in 2020 to 7.6 million tons in 2021, accounting for around 20% of total pipe imports, while pipe gas from middle Asia and Myanmar remains stable.
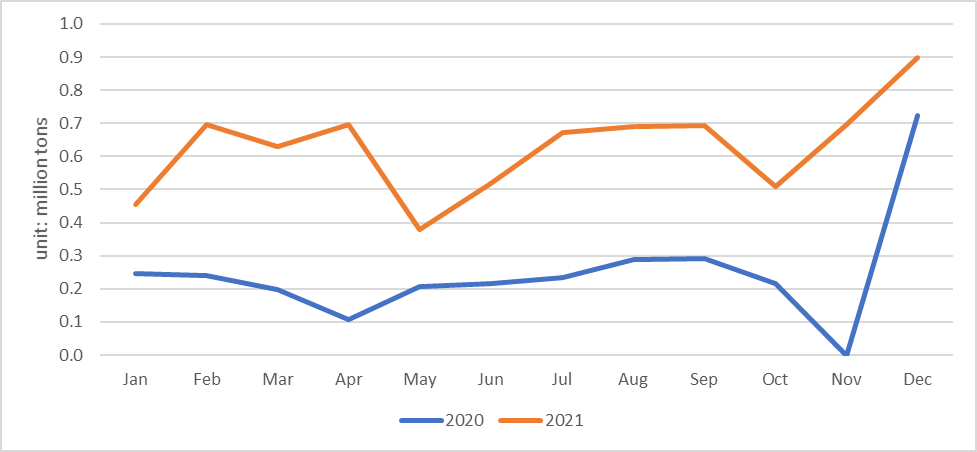
Figure 4: Russia Pipe Gas into China
It is seen from figure 5 that the volatile situation in Kazakhstan has hardly affected its pipe exports to China in late 2021.
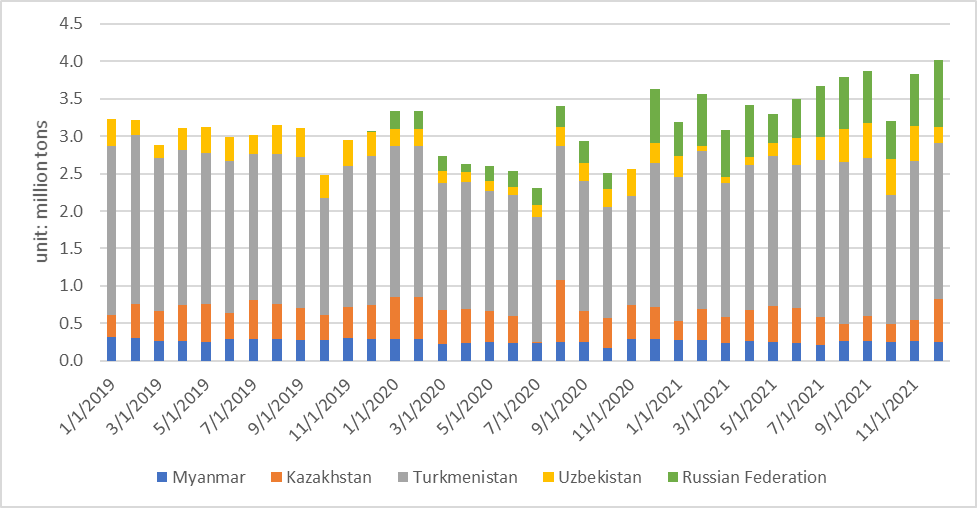
Figure 5: Monthly Pipe Gas Imports by Origin into China
Year 2021 has also witnessed the growing LNG trade between United States and China. Even during such a pandemic period, there are several LNG contracts signed in the last year. According to G2M2 database, the capacity of contracts between United States and China accounts for 46% of those that Chinese companies have signed, which is made up of 60% of contracts that have been confirmed in 2021.
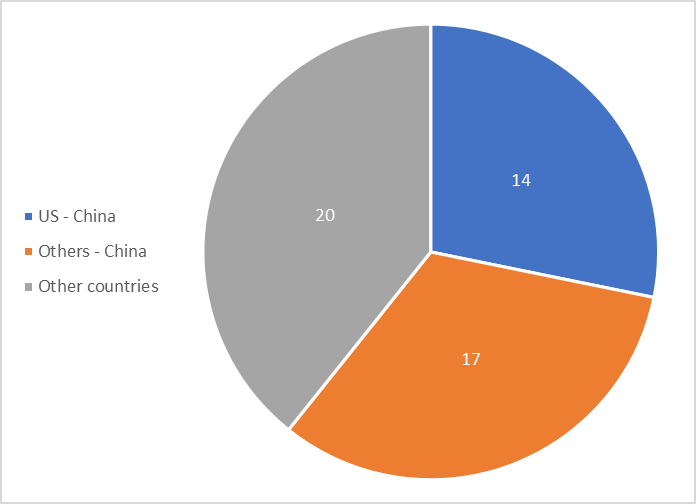
Figure 6: Capacity in LNG contracts signed in 2021, unit: million tons
In an era of frequent natural gas price fluctuations, buyers from both China and Japan are more interested in signing long-term LNG contracts. Who will have more say in LNG pricing in the future and who will be leader of LNG supply chain? Only time will tell.
RBAC, Inc. is a leader in building market fundamental analysis tools used by the energy industry and related government agencies for over two decades. The G2M2® Global Gas Marketing Modeling System™ is designed for developing scenarios for the converging global gas market. It is a complete system of interrelated models for forecasting natural gas and LNG production, transportation, storage, and deliveries across the global gas markets.


