
Gas in a Tighter World: Growth, Risk, and the New LNG Reality
At the same time that surging power demand from AI and expanding LNG export capacity are ushering natural gas into a new phase of growth, geopolitical disruptions are highlighting just how vulnerable global gas supply chains remain. With the conflict in the Middle East ongoing and all eyes fixed on the Strait of Hormuz status of which is still in limbo, market players continuing to hold their breath on how the things continue to develop and what the next upheaval might be.
In this edition of RBAC‘s monthly newsletter, we look at top stories in natural gas and LNG from around the world, highlights from CERAWeek 2026, why some traders love trading prices for years far in the future, the story of U.S. natural gas pipelines and creating today’s market, the current status of the Strait of Hormuz closure, and what Trump’s use of Defense Production Act means and doesn’t mean for U.S. energy.

Want analysis that goes beyond headlines? Join RBAC’s mailing list to receive this newsletter, early access to new articles, and expert perspectives delivered straight to your inbox.
Top Stories in Natural Gas and LNG from Around the World
Shell to acquire Canada’s ARC in output-boosting $16.4 billion deal
Data center demand drives 66% surge in natural gas power plant costs
IEA says Iran war will keep the global natural gas market tight for two years
Enbridge B.C. natural gas pipeline expansion receives federal approval
All the alternative routes for Middle East oil and gas to bypass the Strait of Hormuz
Quick Brief - EIA expects U.S. natural gas exports to grow nearly 30% by 2027
In the latest edition of the Energy Information Administration’s Short-Term Energy Outlook, they expect both LNG exports and pipeline exports to see significant growth over the next two years.
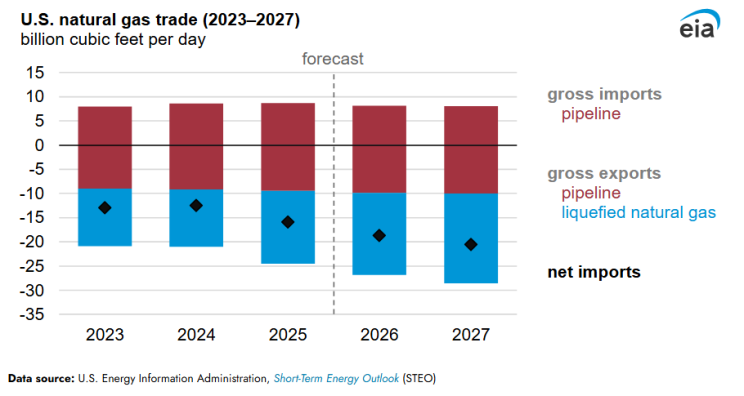
The EIA predicts that net U.S. natural gas exports are forecast to increase by 18% in 2026 and another 10% in 2027, while LNG exports alone are projected to reach 17.0 billion cubic feet per day (Bcf/d) in 2026 and grow further in 2027. This growth is supported by several new LNG export facilities coming online and increased utilization of existing terminals, especially as global supply disruptions, such as those affecting Qatar and the Strait of Hormuz, boost demand for U.S. LNG.
Europe has become the dominant destination for U.S. LNG exports, accounting for 68% of volumes in 2025, while exports to Asia declined and shipments to countries like Egypt rose sharply. Pipeline exports, primarily to Mexico, are expected to continue increasing due to rising demand for electricity generation and new LNG export projects in Mexico that rely on U.S. gas. Overall, the U.S. is strengthening its position as a major global natural gas supplier, with export growth driven by infrastructure expansion and evolving international demand.
As export capacity expands and global demand pulls more U.S. gas into international markets, how will U.S. pipeline system respond? Where do bottlenecks form first? How do prices get impacted and where? And what happens when competing demand, e.g. power, and data centers, begins to tighten in certain regions?
These are the types of questions market simulation tools like RBAC’s GPCM® Market Simulator for North American Gas and LNG™ are designed to answer, allowing analysts to test scenarios and understand how the market could evolve under different assumptions. Learn more below.
Articles & Media
What the Data Shows Us About Building Natural Gas Pipelines Part 3
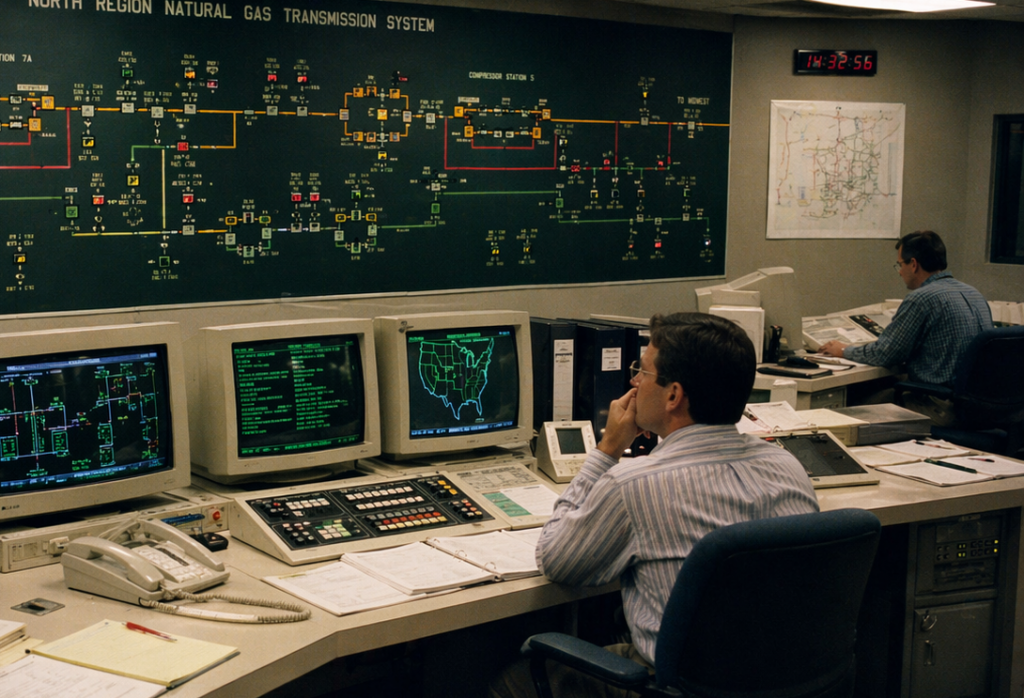
In Parts 1 and 2, we explored how pipelines and markets evolved from regulation to competition. In Part 3, we examine how the market evolved from 1997 to the market we know today, beginning with how participants tried to forecast and plan within a system that had become too complex to see all at once.
Read: What the Data Shows Us About Building Natural Gas Pipelines Part 3
What Trump’s Use of the Defense Production Act Means for Oil & Gas, and What It Doesn’t

On April 20, 2026, the Trump administration invoked Section 303 of the Defense Production Act of 1950 (DPA) across oil, natural gas, LNG, power generation, grid infrastructure, and coal. The federal government is now stating explicitly that energy production and infrastructure shortfalls now constitute a national defense risk, and that market forces, permitting regimes, and capital markets cannot be relied on to fix them fast enough.
Read: What Trump’s Use of the Defense Production Act Means for Oil & Gas, and What It Doesn’t
Assessing Energy Security Chokepoints

“While the April 2026 ceasefire opened the door to traffic potentially resuming through the Strait, renewed tensions and security risks have continued to constrain LNG cargo movements out of the region. Europe has continued to seek additional supply from the U.S., and the entire situation underscores how quickly global energy flows can be disrupted, and how fragile that stability remains.”
What the Data Shows Us About Building Natural Gas Pipelines Part 2
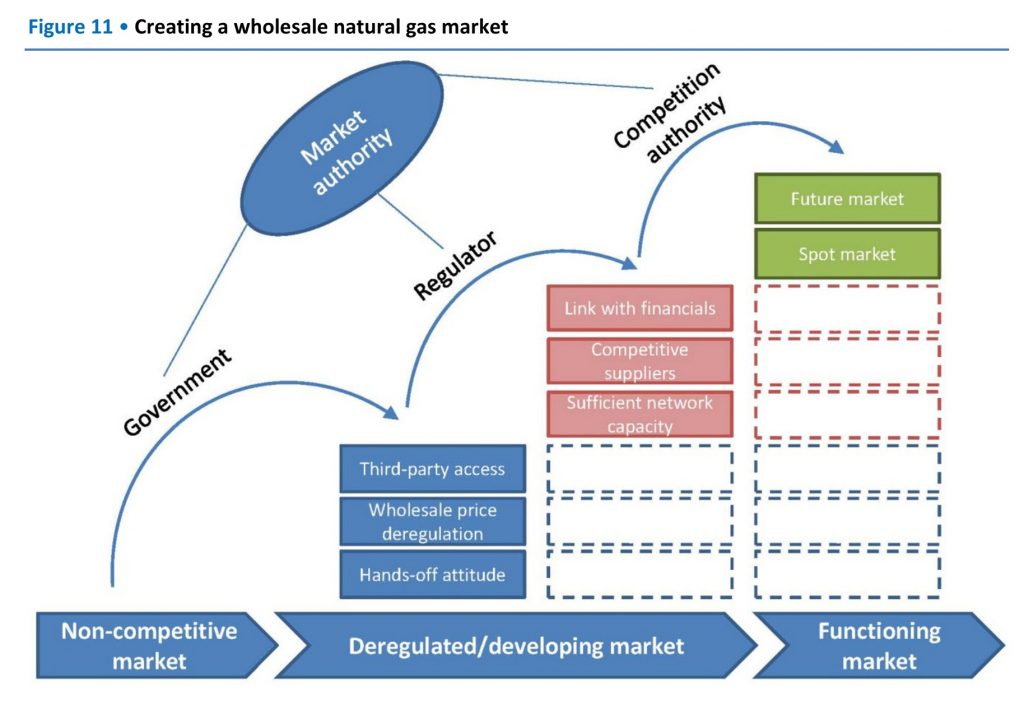
In Part 1, we traced how the U.S. natural gas system matured from the first long-distance pipelines into a regulated interstate network, then through shortages, deregulation, and the restructuring that turned pipelines into open-access transporters. In Part 2, the story shifts from the pipelines in the ground to the market forces moving through it: trading, open access, price signals, and the way supply, transportation, storage, and time finally began clearing together across one connected system.
Read: What the Data Shows Us About Building Natural Gas Pipelines Part 2
Why Some Traders Love “Long-Dated Risk”

In the world of natural gas, “long-dated risk” simply means making a bet on what gas will cost a long time from now—like 2, 5, or even 10 years away. In the industry, we call this trading the “back of the curve” (the prices for years far in the future). Some traders love trading this portion of the curve for a couple of reasons.
Why Some Traders Love “Long-Dated Risk”

CERAWeek 2026 wrapped up against a backdrop of tightening supply and demand balances and rising geopolitical risk: conditions that are rapidly reshaping how natural gas, LNG, and infrastructure are being evaluated across global markets.
Read: Gas, Geopolitics, and the Grid: Key Signals from CERAWeek 2026
Essential Reading
Taken from the treasure trove of the writings from our energy experts. Here read technical insights and far-sighted analysis relevant through the lens of today’s energy.
From Russia to the Rest: How Europe’s Russian Gas Ban Could Reshape
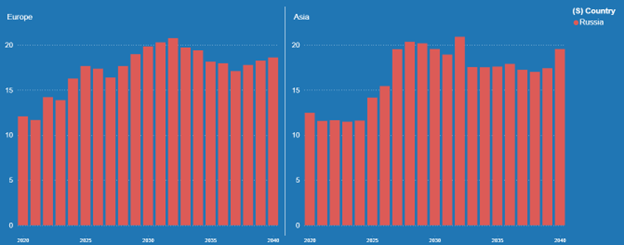
The European Union has started to roll out import bans on Russian LNG with the complete ban taking effect in 2027. How will this shape Europe’s gas market especially given current volatility in the global market?
Read: From Russia to the Rest: How Europe’s Russian Gas Ban Could Reshape Global Energy Trade
Food For Thought
Read some of our engaging commentary on social media and join us in the conversation.
The United Arab Emirates Leaves OPEC

“This is clearly a pivotal shift in the global energy landscape as the UAE officially withdraws from OPEC. While much of the market chatter is focused on crude oil quotas and “1 million additional barrels,” the affect on natural gas is not insignificant.”
RBAC is the market-leading supplier of global and regional gas and LNG market simulation systems used by the energy industry and related government agencies for over two decades. The GPCM® Market Simulator for North American Gas and LNG™ is the most widely used natural gas market simulation system in North America. RBAC’s G2M2® Market Simulator for Global Gas and LNG™ has been instrumental in understanding evolving global gas and LNG market dynamics and is vital to fully grasp and leverage the interrelationship between the North American and global gas markets.