Western players have been watching intently as China does a balancing act—importing more Russian gas via pipeline, reselling surplus LNG at high prices on the international market and signing long term contracts with US LNG producers. Though in recent news we have seen tensions between China and the West, have these tensions spilled over into the demand for western LNG? And what do LNG players need to know about changing LNG demand in China?
In 2006, China became a new LNG market for the West with Australia’s first LNG shipment of a 25-year agreement signed in 2002. Since then, China has seen considerable growth in LNG imports, the steady increase turning into a rocket in 2015. By 2021 China surpassed Japan to become the world’s largest LNG importer. But the 2022 energy crisis and Russia-Ukraine conflict has shaken up all conceptions of how to source your energy, and China has had a re-think of its own.
According to China’s customs agency, January-to-June 2022 LNG imports dropped from 40 to 31 million compared to 2021, a near 22% decrease (see chart 1) allowing Japan to reclaim the spot as top global LNG importer with 38[1] million tons imported in the first half of this year, according to Trade Statistics of Japan.
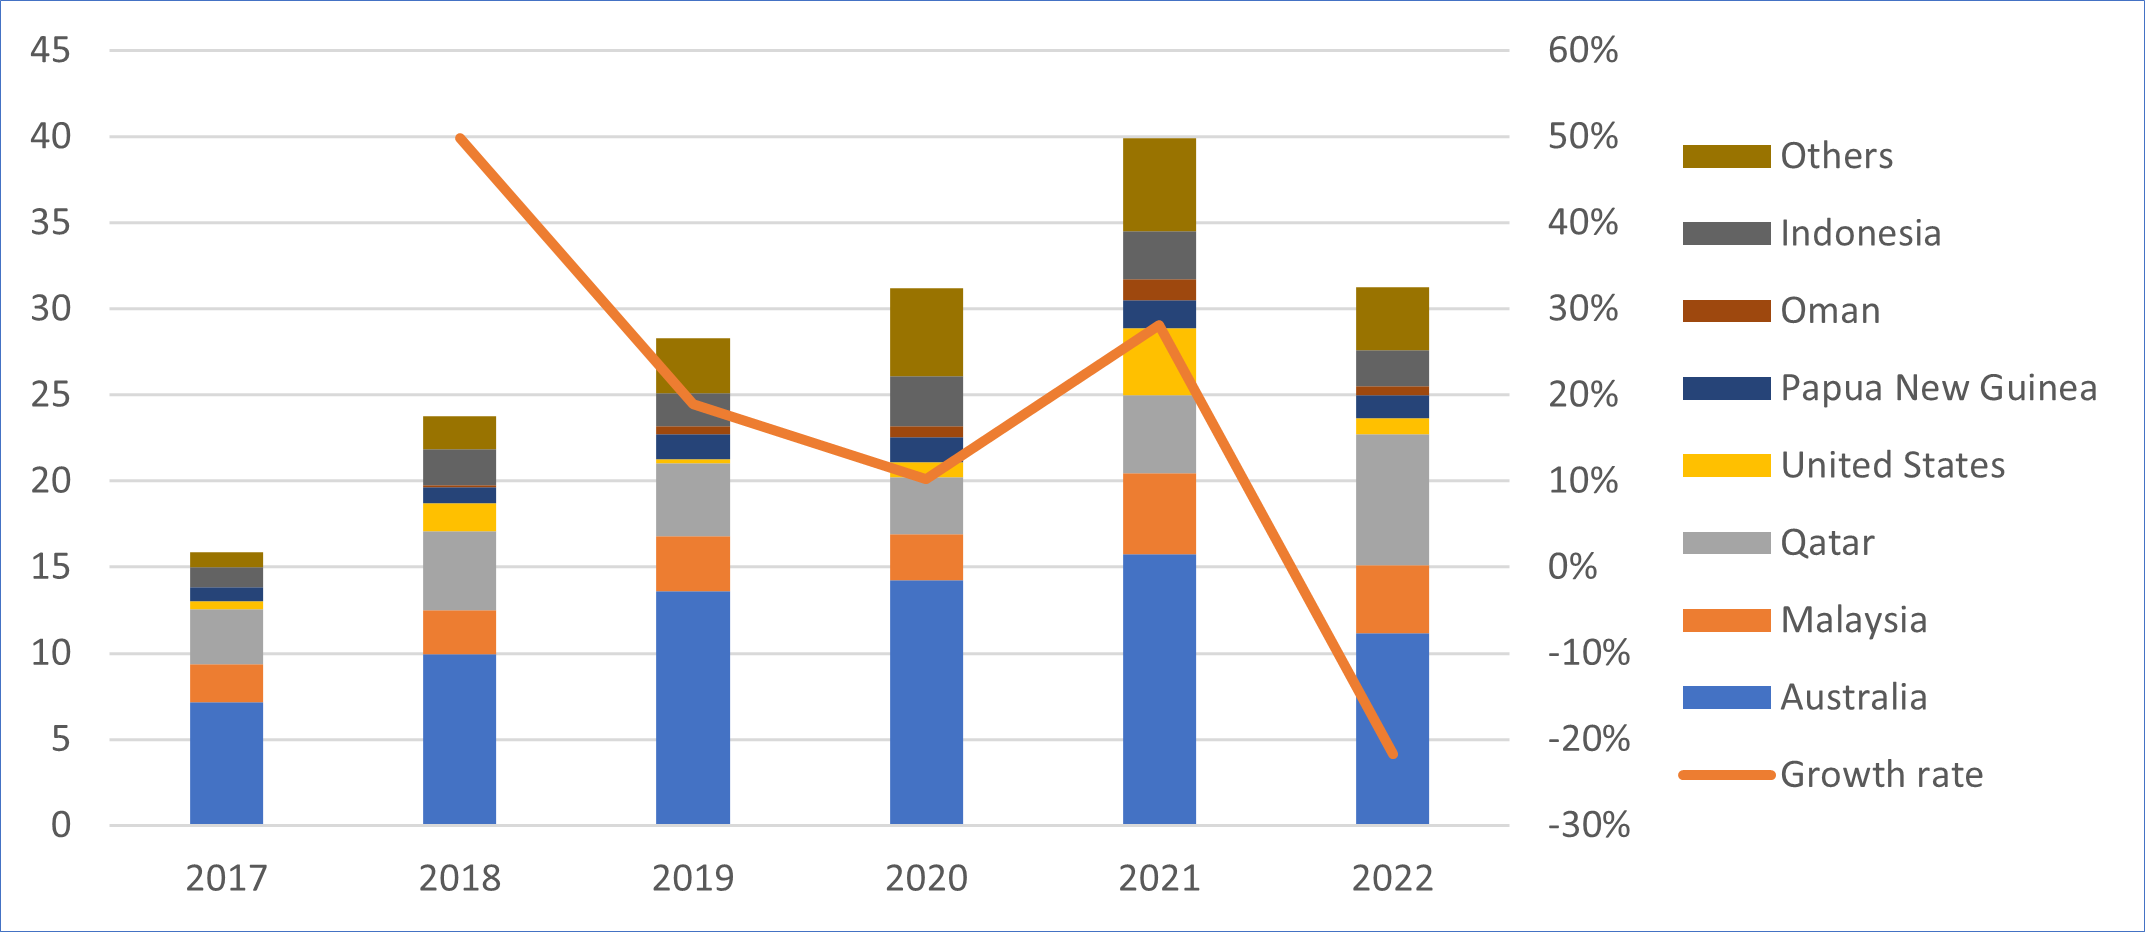
Chart 1: China LNG Imports by Origin from Jan to Jun, unit: mtpa
Along with city controls and decreased economic growth in early 2022, the growth rate of gas demand in China slowed down. Natural gas consumption in the first half of the year was 182 billion cubic meters, down slightly from 183 billion cubic meters in 2021, according to National Development and Reform Commission of China. Although this half year’s natural gas consumption growth is basically flat, month-on-month demand is declining, -5.2% and -4% in May and June respectively. Meanwhile, domestic gas production has increased 5% for January to June 2022 versus 2021, from 104 billion cubic meters to 110 billion cubic meters.
The two countries most affected are Australia (dropping from 16 to 11 million tons) and the United States (from 4 to 1 million tons). Interestingly, there is no indication to show that the decreased LNG imports from Australia or United States into China resulted from political tensions between China and the West. On the contrary, the past six months witnessed two sales and purchase agreements in LNG contracts between NextDecade and China Gas Holdings, Cheniere and PetroChina. Further, as domestic news reported, since the start of the Russian-Ukrainian conflict, Chinese companies have resold LNG cargos to Europe and earned considerable income. Unipec, a subsidy of China’s state-owned Sinopec, sold at least three LNG cargoes for delivery by June to ports in Europe[2]. Dongguan Jovo, a privately-owned company in Guangdong in southern China, sold an LNG cargo to Italy[3]. Felix Booth, head of Vortexa’s LNG analysis, says he believes the companies could earn about $150 million from each shipment[4].
Pipeline flows has also played a role in changing Chinese LNG demand. Since January 2022, gas flow data from Gazprom has been unavailable or limited and similarly from China’s customs agency there has been only revenue data, instead of volume, for each country who exports pipe gas into China. Yet, some inspiration can still be drawn from the data available.
As chart 2 below shows, total volume of pipeline gas imports increases 10%, from 20 million tons to 22 million tons between 2021 and 2022 from January to June. This month, Russian company SANA announced that flows of Russian natural gas through Power of Siberia to China increased by 60.9% in seven months[5]. If 60.9% is treated as the monthly average growth rate, last year’s gas flow between Russia and China is around 3.4 million tons from January to June in 2021 and it can be estimated that this year’s gas flow between Russia and China from January to June is around 5.5 million tons. Therefore, it can be concluded that most of the pipeline gas growth comes from Russia. At the same time, there is still room for Russian gas growth, as current gas flow is less than half of the designed capacity, which is 38 billion cubic meters per year (around 28 million tons per year).
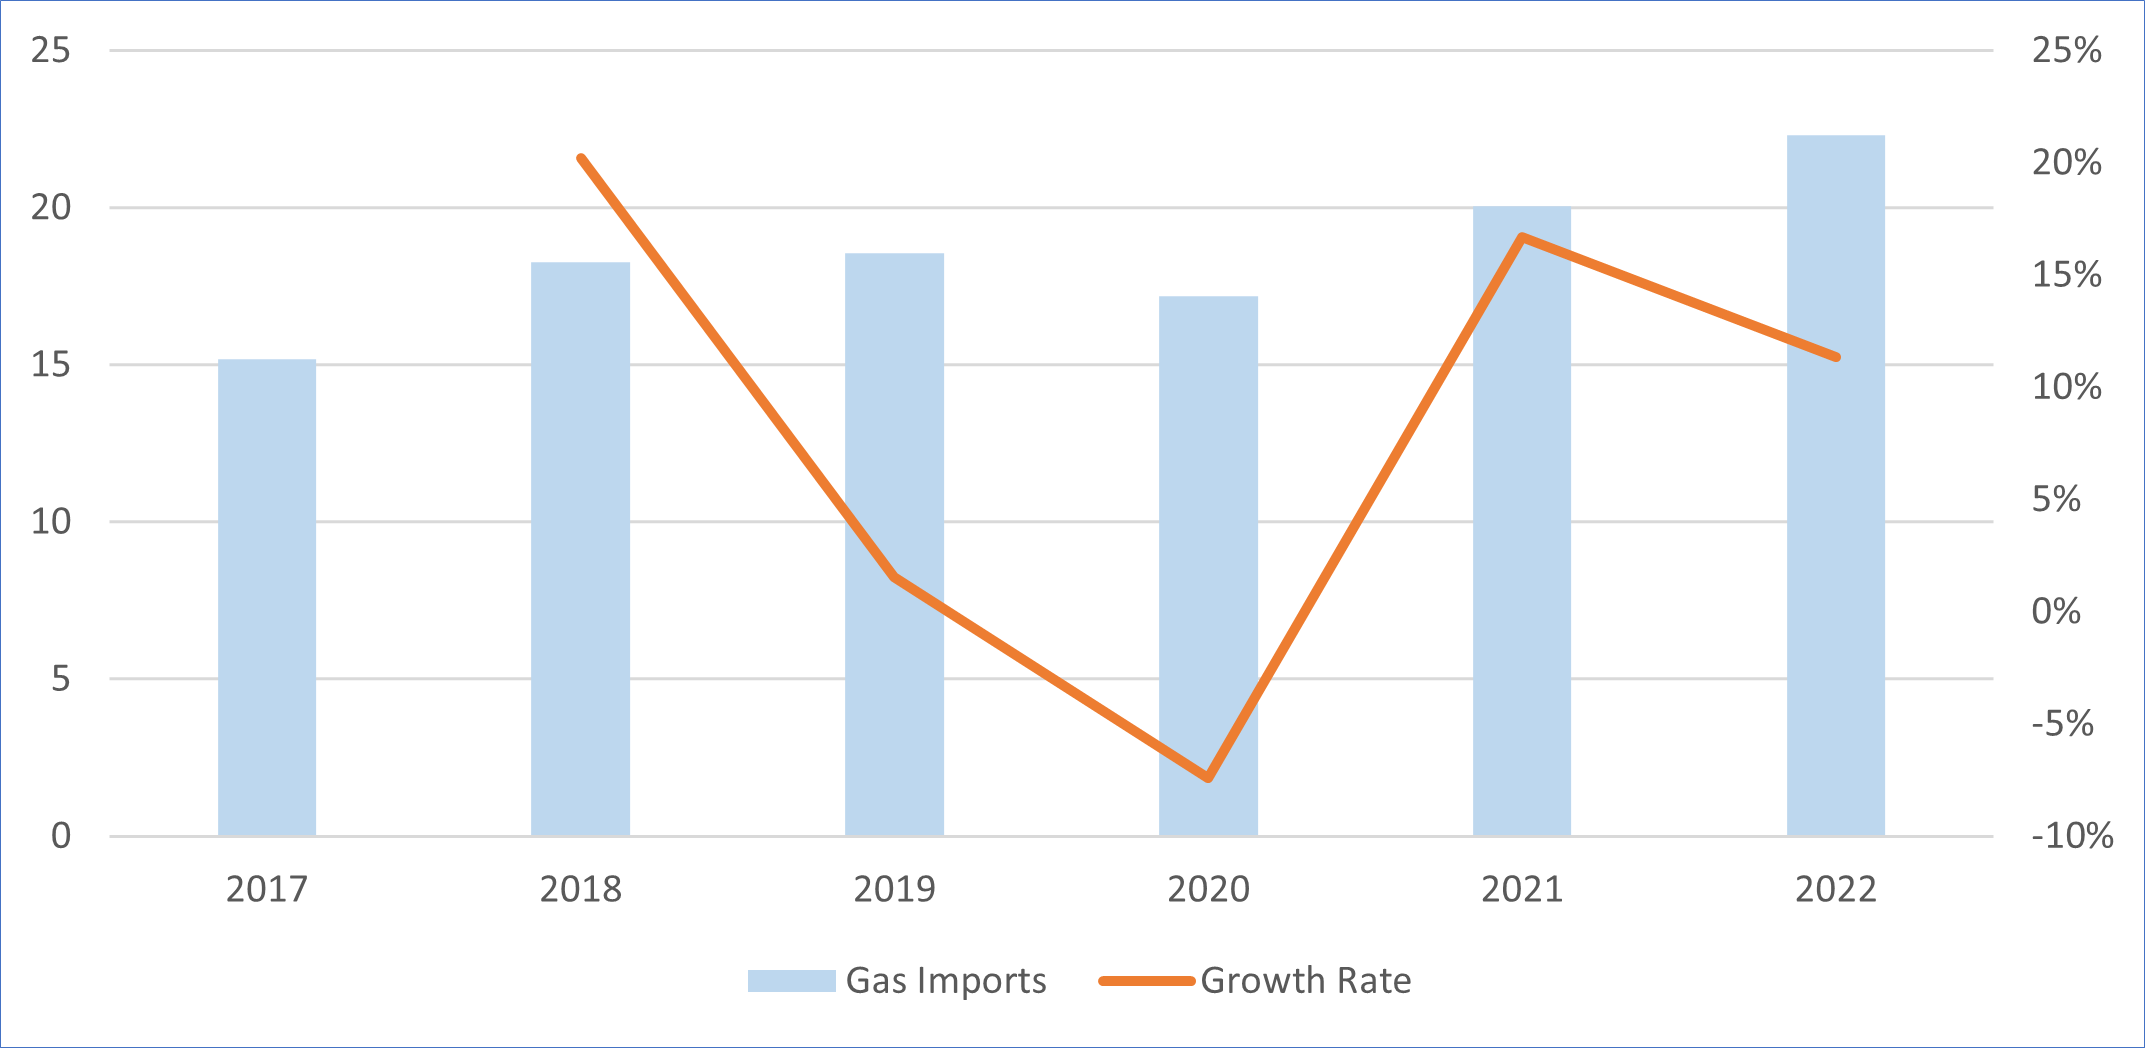
Chart 2: China Pipe Imports by Origin from Jan to Jun, unit: mtpa
This leads us to several unanswered questions.
With the coming of winter, will gas consumption rebound, elevating China back to the largest LNG importer in 2022?
How will China’s gas traders play their cards in the global gas market and what impact will it have?
Could Power of Siberia run at full capacity and by when? If so, how would it impact China’s, or other Asian countries’ LNG trades?
Using RBAC’s G2M2® Market Simulator for Global Gas and LNG™ we can model different potential scenarios under various assumptions and situations. For example, in early 2022, NRG Weekly[6] published an article on the impact of Power of Siberia 2 on Japan’s LNG portfolio strategy for LNG imports. Other scenarios can also be considered, for example, more Russian gas coming into China, no Russian gas coming into Europe or high domestic demand with an extremely cold winter. This is a more reasonable and visible future that G2M2 can provide its users.
Right now, it appears that as long as the Russia-Ukraine conflict and related European sanctions continue Russian pipe gas will increasingly flow to China, while reducing the need for LNG. Yet, a multitude of LNG contracts between China and United States will be executed in the mid-2020s. Where will those LNG cargos eventually go? Will they be part of China’s energy security or further capitalization on high global prices? Stay tuned.
Data sources: http://online.customs.gov.cn/, https://www.customs.go.jp/
RBAC, Inc. is the market leading supplier of global and regional gas and LNG market simulation systems. The GPCM® Market Simulator for North American Gas and LNG™ is the most widely used gas market simulation system in North America. RBAC’s G2M2® Market Simulator for Global Gas and LNG™ is designed for forecasting gas and LNG production, transportation, storage, and deliveries across the global gas markets. These systems provide industry analysts powerful tools for supporting corporate investment and M&A strategy, achieving environmental and sustainability goals, risk analysis and trading. For more information visit our website at http://www.rbac.com.
[1] https://www.customs.go.jp/
[2] https://www.bloomberg.com/news/articles/2022-03-15/china-sells-some-spare-u-s-gas-to-europe-for-a-hefty-profit
[3] https://www.spglobal.com/commodityinsights/en/market-insights/latest-news/lng/042922-china-flips-to-selling-lng-export-cargoes-as-pandemic-curbs-dent-demand
[4] https://kucnews.com/how/us-natural-gas-to-europe-how-energy-traders-are-making-a-fortune-2-67158.html
[5] http://www.sana.sy/?p=1708438, https://newsrnd.com/news/2022-08-01-russia-s-gas-exports-to-china-increase-by-60-percent.r1ex2rrBpq.html
[6] https://rbac.com/japans-lng-energy-security-has-a-cost-estimating-the-price-of-supply-diversity/