RBAC Inc., Energy Market Simulation Systems

What Rising LNG Supply Means for Prices: U.S. vs. Global Expansion

The United States currently leads the LNG market in terms of exports with 14.49 Bcf/d worth of existing capacity. The global LNG market is rapidly expanding, and every country wants to get in on the action whether it’s through investments into import or export infrastructure.

The United States is determined to not lose its top spot in the market and has several projects set to come online over the next few years. What projects have already been approved for construction or are already under construction? And what projects are awaiting approval from the Federal Energy Regulatory Commission (FERC) or are in pre-filing?

Approved and Under Construction

The U.S. is set to add even more export capacity in the coming years with several facilities already undergoing construction.

  • ExxonMobil – Golden Pass, 2.57 bcfd
  • Venture Global – Plaquemines), 3.76 bcfd
  • Woodside – Louisiana LNG, 3.81 bcfd
  • Cheniere – Corpus Christi Stage III & T 8-9, 2.06 bcfd
  • Sempra – Port Arthur LNG Trains 1 & 2, 1.86 bcfd
  • NextDecade – Rio Grande LNG, 3.73 bcfd
  • Venture Global – CP2, 3.96 bcfd

These projects’ total 21.75 bcfd which would more than double the current total capacity within the country.

Approved and Not Under Construction

In addition to the above projects which are already under construction, even more have been approved but have not begun yet.  Even though a project has government approval, it might not go ahead.  It also has to get market acceptance via commitments for offtake and financial backing (investment).   These projects have government authorization but do not yet have sufficient market acceptance for Final Investment Decision (FID).

  • Energy Transfer – Lake Charles LNG, 2.27 bcfd
  • Glenfarne Group – Magnolia LNG, 1.22 bcfd
  • Sempra – Cameron LNG Train 4, 0.93 bcfd
  • Freeport LNG Train 4, 0.74 bcfd
  • Kinder Morgan – Gulf LNG Liquefaction, 1.50 bcfd
  • Eagle LNG – Jacksonville LNG, 0.13 bcfd
  • Glenfarne Group – Texas LNG Brownsville, 0.62 bcfd
  • Alaska Gasline – Alaska LNG, 2.76 bcfd
  • Kimmeridge – Commonwealth LNG, 1.21 bcfd
  • Sempra – Port Arthur LNG Trains 3 & 4, 1.83 bcfd

All of these project’s total to 13.21 bcfd and when combined with existing infrastructure and ones already under construction, the U.S. LNG export capacity would become 56.35 bcfd.   This is equivalent to about 580 BCM/Yr or 450 MTPA (million tons per year).

Other Projects

There are also a handful of projects that are in the proposal stage to FERC or in the prefiling stage.

  • Cheniere – Sabine Pass – Stage 5, 2.6 bcfd (Proposed)
  • Gulfstream LNG, 0.55 bcfd (Proposed)
  • VG Plaquemines – Plaquemines LNG – Expansion, 2.57 bcfd (Pre-filing)
  • Corpus Christi Liquefaction Stage 4, 3.22 bcfd (Pre-filing)

How does this increase in U.S. LNG export capacity compare to other countries?

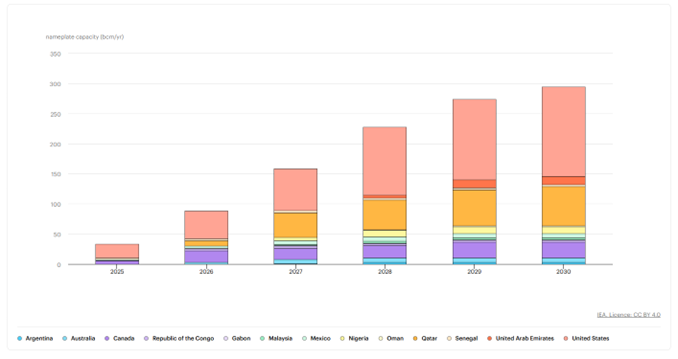
The U.S. is not alone when it comes to being a major LNG exporter and also when it comes to expanding capacity. Historically, countries such as Qatar, Australia, Indonesia, and Russia have been at the top of the list when it comes to exports. Qatar’s North Field East natural gas expansion project is particularly notable as it is expected to nearly double its current LNG production, 77 mtpa to 126 mtpa, by 2027.

We may also soon see some new faces appear in the market. Countries across Africa are a hotbed for energy investment and possess vast reserves of natural gas and have several export projects in the pipeline. Saudi Arabia and Iran are also looking to join the LNG export market with Saudi Arabia having committed a $100 billion investment in LNG.

The International Energy Agency reports that, “Between 2025 and 2030, a total of nearly 295 BCM/yr (about 227 MTPA or 28.5 bcfd) of new LNG export capacity is expected to come online from projects that have already reached FID and/or are under construction.”

Figure 1: Cumulative LNG liquefaction capacity additions from post-FID projects 2025-2030. Source: IEA

Where will this LNG flow?

The primary import markets for LNG will be Europe and Asia with Asia having a much more significant demand. In 2030, Asia’s demand is expected to reach 459.02 mtpa compared to Europe’s 173.70 mtpa, nearly two and a half times the market size.

Figure 2: LNG Flows to Europe and Asia 2015 - 2030 (mtpa) with total regas capacity. Source: G2M2 Data Visualizations.

Within Asia, China, South Korea, India, Japan, Thailand, and Pakistan are expected to lead the charge in terms of LNG demand.

Figure 3: LNG Flows to Asia by Country 2015 - 2030 (mtpa). Source: G2M2 Data Visualizations.

And France, Germany, Netherlands, Spain, Greece, and the United Kingdom at the top for Europe.

Figure 4: LNG Flows to Europe by Country 2015 - 2030 (mtpa). Source: G2M2 Data Visualizations.

Is there a risk of LNG oversupply?

With countries around the world beefing up their LNG infrastructure, what happens if demand is less than expected and there is too much LNG available in the market?

With so much LNG to go around, the buildout would create a supply glut that would lower prices globally by a significant amount.

In the graph below, LNG prices at Henry Hub (HH),  Dutch Title Transfer Facility (TTF) and Japan/Korea all decline as new LNG capacity comes online. The prices reach the lowest point in 2031 dropping to $4.99 at HH, $6.25 at TTF and $7.54 at JPN/KOR as LNG capacity buildout outpaces LNG demand.

Figure 5: LNG Prices at Henry Hub, Dutch Title Transfer Facility, and Japan/Korea 2025-2035. Source: G2M2 Data Visualizations.

At this same time the spread between Henry Hub and TTF and Henry Hub and JPN/KPR also reaches a low dropping to $1.26/MMBtu and  $2.55/MMBtu, respectively.  With prices this low, the spreads are not large enough to cover the costs of transportation from the U.S. to Europe or the U.S. to Asia, greatly reducing spot market opportunities for US LNG producers. In fact, during this period, our forecast shows limited spot activity with US LNG flows mostly coming from contracted volumes.

Figure 6: Price Spreads at TTF and JPN/KOR compared to Henry Hub 2026 - 2035. Source: G2M2 Data Visualizations

In total, by 2030, we have global LNG export capacity rapidly increasing  demand growth slowing in Asia and declining in Europe all resulting in LNG prices that are forecasted to be half of what they are now. Additionally, with other emerging sources of demand such as AI and data centers could necessitate even more significant alterations to supply, demand, and price forecasts.

Uncertain market scenarios such as this are exactly why modeling and simulation tools such as the G2M2® Market Simulator for Global Gas and LNG™ exist. G2M2 can be utilized to see the impacts of new infrastructure coming online, freely adjusting for different high and low demand scenarios.

Interested in learning more about G2M2? Contact us here for more information and to schedule a free demonstration.

RBAC, Inc. has been the leading provider of market fundamental analysis tools used by the energy industry and related government agencies for over two decades. The GPCM® Market Simulator for North American Gas and LNG™ is the most widely used natural gas market modeling system in North America. RBAC’s G2M2® Market Simulator for Global Gas and LNG™ has been instrumental in understanding evolving global gas and LNG dynamics and is vital in fully understanding the interrelationship between the North American and global gas markets.

Contact Us

E-mail:

contact@rbac.com

Contact Numbers:

Administration:   (281) 506-0588
Sales:                    (281) 506-0588 ext. 126
Support:               (281) 506-0588 ext. 125

E-mail:

contact@rbac.com

Contact Numbers:

Administration:
(281) 506-0588
Sales:
(281) 506-0588 ext. 126
Support:
(281) 506-0588 ext. 125

News