Co-written by: Scott McKenna, Director, Global Energy Analysis, RBAC, Inc
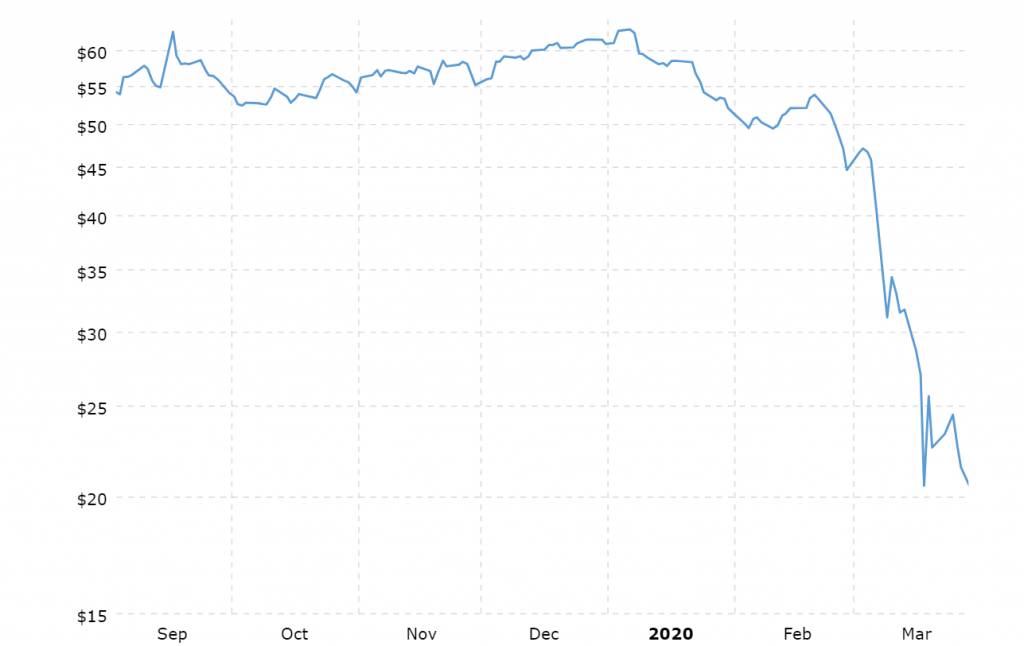
When electronic trading opened on Sunday night, March 8th, all hell broke loose for WTI crude oil, as the market gapped lower by nearly $10/Barrel (Bbl). The price decimation was driven by Saudi Arabia cutting their crude oil Official Selling Price (OSP) and reversing production curtailments – which were part of OPEC’s agreement to attempt to balance supply and demand – and increasing production to levels which would test their overall productive capacity. All of this occurred amid the rapid global spread of COVID-19, which is still creating a demand shock to global macroeconomic activity and especially energy commodities.
The Saudi’s drastic reversal was in response to Russia’s reluctance to agree to further production cuts deemed necessary to offset the COVID-19 demand destruction. Saudi Arabia used its leverage as the lowest cost crude oil producer, excluding any government budget requirement inclusions, to initiate an oil price war. Russia appears willing to play the game given their likely frustrations with U.S. shale production’s rapidly growing market share and U.S. sanctions against Russia (e.g., Nord Stream II impacts). The culmination of these events has caused crude oil prices to plummet. The WTI benchmark recently traded at just under $19.50/Bbl as the Apr20 futures contract expired.
U.S. oil and gas producers are responding to these price signals through further reductions in capital expenditures and shifting focus to the most profitable production areas in their respective asset portfolios. Similarly, governments around the world are taking unprecedented measures to thwart the spread of COVID-19 by mandating business closures, lockdowns of cities and communities, as well as forcing businesses to alter production of goods and services. Obviously, all of these decisions will have a dramatic impact on expected future oil and gas supply and demand, some of which will be felt immediately while others will be realized over a longer timeframe. So, what will these impacts mean for pricing and have we seen the worst of things yet? In other words, Where Are We and What is a Handbasket?
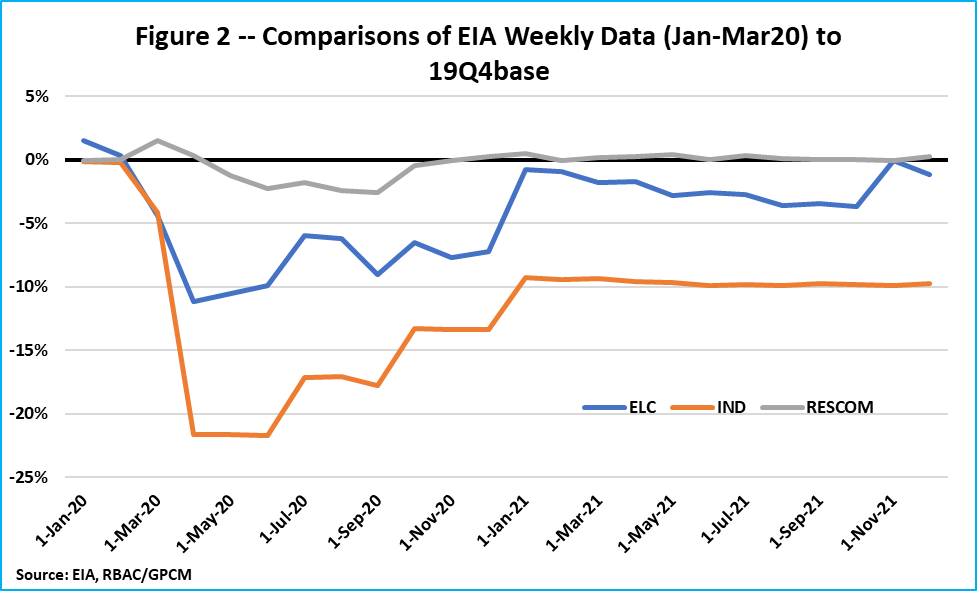
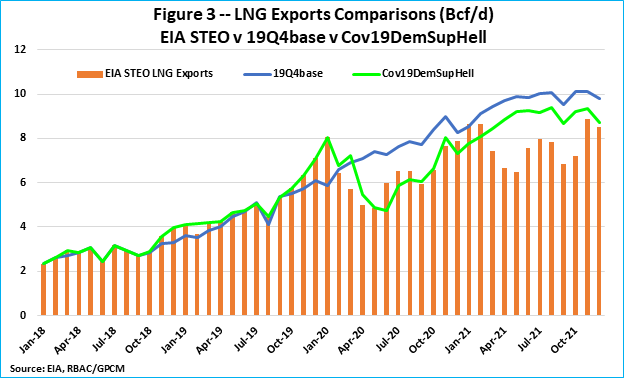
To help assess the potential current and future market dynamics from a “hell in a handbasket” scenario, RBAC has used its flagship product, the GPCM® Natural Gas Market Forecasting System™. The scenario assumes gas-fired power generation, industrial gas demand, and U.S. LNG export demand all experience exceptional declines, while commercial and residential demand largely offset each other. Commercial demand falls while residential natural gas demand increases due to population activity shifting from working at offices to staying home. By way of comparison, Figure 2 below shows the percent increases and decreases relative to EIA’s weekly demand data and RBAC’s quarterly release (19Q4base) published at the end of January 2020, and Figure 3 below compares U.S. LNG exports in RBAC’s 19Q4 release to EIA’s Short Term Energy Outlook (STEO) published on March 11th.
Although pipeline nominations data has yet to show any dramatic declines, slightly lagged to contemporaneous economic indicators are already showing the demand shock impacts. Some examples:
- Initial jobless claims set a record last week at approximately 3.3 million (the prior record was 695,000 set on October 2, 1982)
- New home sales falling 4.4%
- Various FED regional manufacturing indexes drop 20+ points
- Petchem and copper prices have dropped significantly over the last few weeks – these are harbingers for economic activity
The precise declines in industrial gas demand and gas-fired power generation are difficult to predict, but it is reasonable to expect significant declines; especially as initial jobless claims are expected to remain elevated over the next several weeks and more areas are locked down.
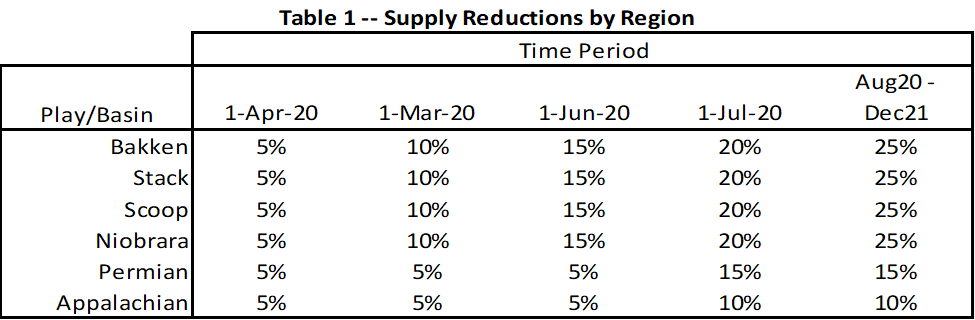
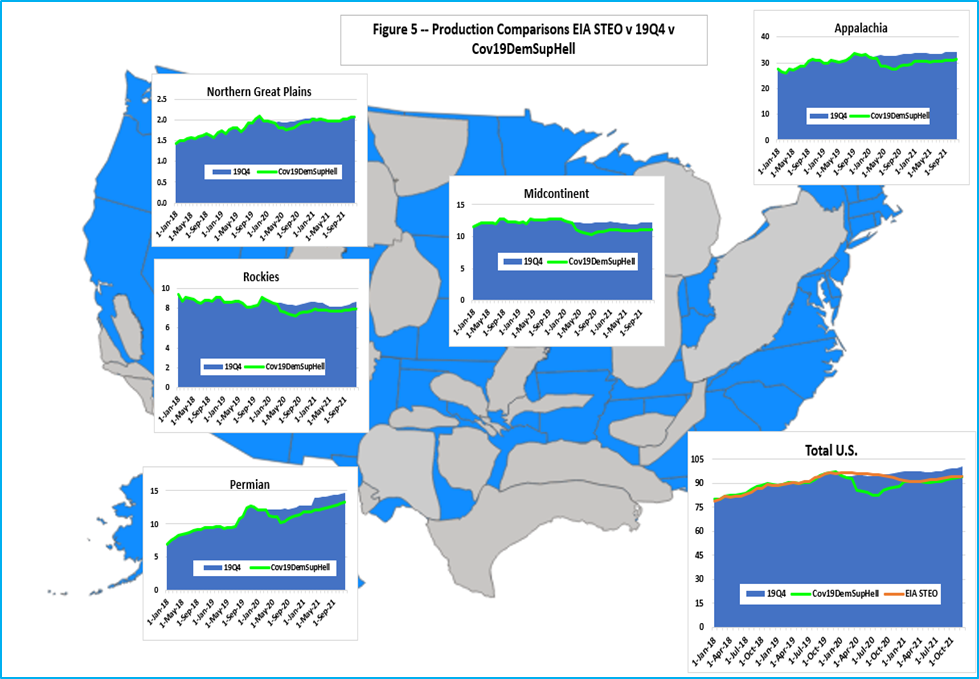
How will production respond to lower prices and at what pace? Producers, in general, have been somewhat hedged for 2020, so the current low prices in the $1.60 to $1.80/MMBtu range are not likely to immediately impede production. However, this could quickly change if a demand shock like this scenario assumes occurs — where gas-fired generation demand declines roughly 8% and industrial demand declines approximately 17% for the balance of 2020. With crude oil prices thus far seeing the brunt of price declines, the impact on supply would likely be more inclined toward oil focused basins, thereby impacting associated gas production. Similarly, given the increasing burden facing gas-centric producers in the Appalachian basin, as well as the impact lower crude oil prices are having on NGLs prices, shale play production in this region has been reduced as well. This scenario assumes the following supply reductions relative to RBAC’s 19Q4base release:
Using GPCM the RBAC team simulated the market implications over the Jan20 to Dec21 forecast period using the supply and demand assumptions above. It is important to note here that although Jan20 and Feb20 have “actualized”, EIA data is still not available to confirm supply and demand values. Monthly average prices, using gas daily prices, however, are known with Henry Hub Jan20 prices equal to $2.01/MMBtu and Feb20 equal to $1.88/MMBtu. For this hellish scenario, the corresponding Jan20 and Feb20 prices are $2.04/MMBtu and $1.86/MMBtu, respectively, so very close to actuals. Comparing Mar20 values, this GPCM scenario is forecasting $1.90/MMBtu vs the Nymex settlement for Mar20 of $1.82/MMBtu and a month-to-date average of the gas dailies equal to $1.75/MMBtu. So far things look pretty good, but…
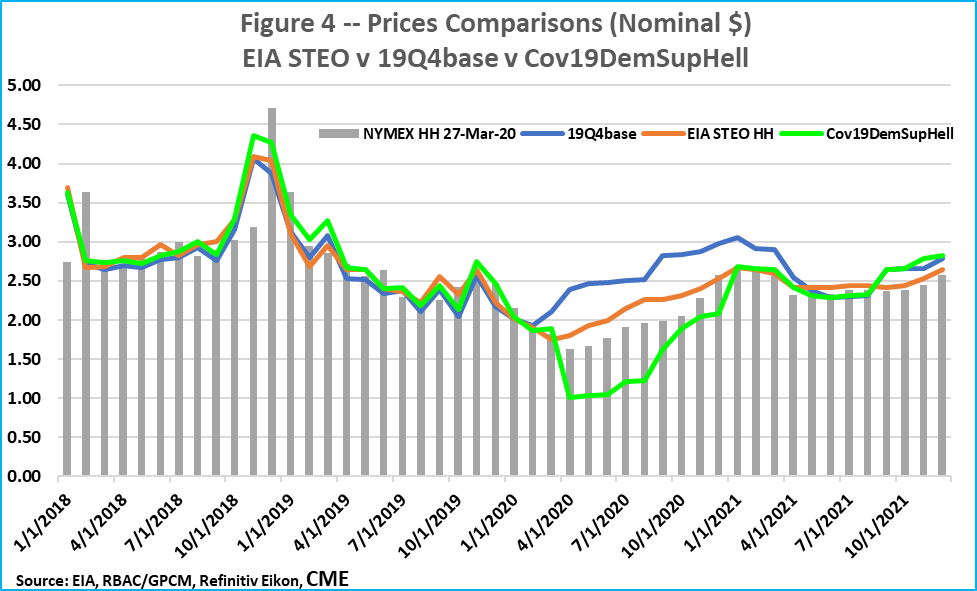
Starting in Apr20, as the demand shock scenario really takes effect, prices crater. With gas-fired power generation and industrial demand expected to drop hardest during 2Q20 and LNG exports falling throughout this period, supply reductions cannot happen fast enough to offset the demand shock. This leads Henry Hub prices to bottom out at $1.01/MMBtu, ironically equivalent to the historic Nymex low print. In such a catastrophic demand scenario, prices hover around this level for all 2Q20 before rallying back over the $1.20/MMBtu level in 3Q20 and reaching $2.00/MMBtu as winter season gets under way in Nov20. Assuming global demand returns to normal by this time, U.S. LNG exports should approach 8.0 Bcf/d, and with a “normal” winter, the worst of the price debacle will be history. However, the magnitude of the price impact will significantly depend on the duration of the negative economic impacts associated with a global pandemic.
As noted in Table 1 above, this scenario also includes supply reductions in the major oil-centric basins along with more moderate reductions in the Appalachia basin. This scenario presents an aggressive supply response to lower prices, at least for the balance of 2020, dropping roughly 10 Bcf/d. During 2021, forecasted production is essentially in line with EIA’s STEO forecast. The throttling back of supply during 2020 has kept prices from dropping further, and coupled with demand rebounding back towards normal, allows prices to rise back over $2.50/MMBtu during the latter portion of 2021.
The global actions to combat the spread of COVID-19 has created a global aggregate demand shock, while the Saudi-Russia crude oil price war has led to a similar but opposite supply shock. Unforeseen events such as these are often called Black Swan or tail risk events – derived from the “rarity” with which these events are expected to occur, like the frequency of seeing a black swan or statistically speaking, two or more standard deviations from the norm.
Regardless of terminology, during these events, daily price movements tend to radically increase, leading to heightened volatility, skittish markets, and possibly panic and fear. Moreover, these events frequently last more than just days, which means volatility begets more volatility. The very definition of these events means that they are largely unexpected (there’s always a “Chicken Little” contingent, so one can never say such events were completely unexpected). Nevertheless, it is prudent for analysts to understand which factors may lead to such developments, and then construct scenarios to better understand the market implications.
As shown from this example, GPCM is tailor-made to quickly accomplish such tasks. Analysts can subsequently assign a probability to such occurrences and more appropriately manage risk. RBAC’s modeling systems are also designed to allow users to easily create multiple scenarios as well as evaluate supply and demand assumptions separately or simultaneously. In this example, RBAC evaluated supply and demand separately and then merged the two final scenarios. RBAC’s modeling systems are designed to make analysts more efficient, productive and proactive, as well as hopefully easing their daily stress levels.
Having a clearer understanding of how markets may respond during these chaotic events can better prepare us for the next time we awaken to markets gapping lower and all hell breaking loose. By staying calm, cool, and collected having modeled these tail risks… instead of us in the handbasket, maybe it will be filled with iced cold drinks and brisket for a BBQ party!