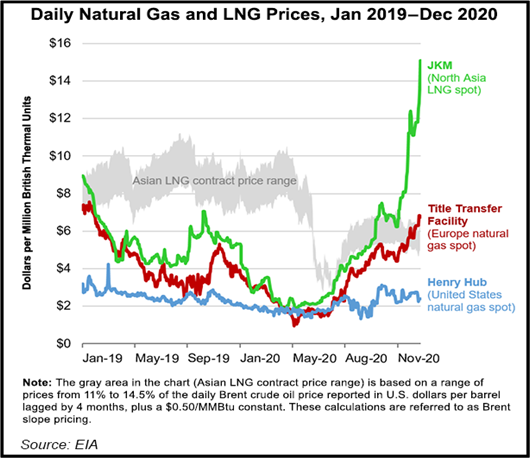
There are two fundamental reasons for such market dynamic for Northeast Asia market:
First, Asia has large seasonal swings of demand with high dependency of imports. Large demand with high seasonal changes could be solved by sufficient and reliable supply. For example, Russia has high seasonal swing of demand, but it has also sufficient domestic production. For Northeast Asian countries, they depend much on gas imports (via pipeline or LNG) to support their gas demand. China has currently 40% of domestic production with 60% of imports from pipeline and LNG. It is expected that China’s supply mix would shift to 60% of imports by 2030, despite its continuous growing production. Japan and South Korea has no adequate domestic production and has been relying on solely LNG imports for decades. Figure 1 takes the ratio of net gas imports versus gas consumption. So, for Europe Central, its net gas imports are about 92% of its total gas consumption, while for Canada, Mexico and US combined is a net exporter of gas which is around 6% of its total consumption. We could see that Northeast Asia has about 63% of its consumption imported currently, like Northwest Europe. The reason that Southwest Europe could have net imports higher than 100% of its consumption in 2020, is due to its underground storage. As seen in Figure 2.
Figure 1- Sub Regional Net Imports vs Gas Consumption
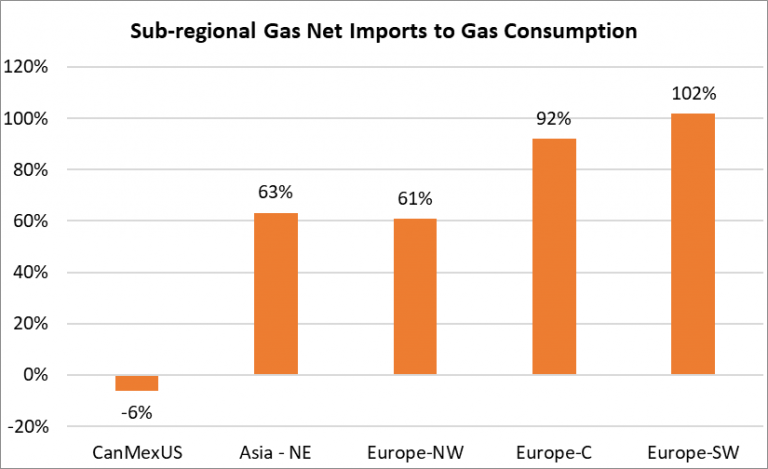
Second, the low storage capacity in Asia compared to its high demand. Not only do the LNG buyers in Asia not share any physical connectivity through pipelines, but each of them also has limited underground storage capacity to help hedge the seasonal price swings. Figure 2 looks at local underground storage capacity (not usage) compared to total consumption for these top gas markets. This is where it gets interesting: All markets other have at least 10% above underground storage capacity to match its consumption, while Northeast Asia has only 2%. This is very similar to Algonquin market price in the US. With limited storage and pipeline options, the Algonquin basis usually experience extreme price spikes in the winter.
Figure 2-Sub Regional Gas Storage Capacity vs Gas Consumption
So, for these fundamental reasons, northeast Asia is not a very liquid market compared to the European TTF and North American Henry Hub, where it is possible to have competitive trading and transaction between many buyers and sellers. JKM price is an index price of LNG cargos arriving in South Korea and Japan, which are two separate markets with no physical connections. Therefore, we have observed higher volatility for Asia price marker in the past.
To bring liquidity into Asia market and reduce price risks, many Asian countries are working diligently on setting up market trading hubs. However, although setting up market hubs are necessarily, it does not solve the fundamental problems of connectivity and liquidity in the region. Therefore, we have market hubs with low trading volume or limited flexibility. So, as one of the fastest growing regions for LNG in the world, what could we consider as an effective strategy for price risks?
Due to this lack of liquidity, many Asian buyers use alternative strategies to manage price risks, including long term contracts, gas to power projects, and vertical value chain management (including acquiring shipping and upstream assets). However, with low oil price and aggressive climate policies in Europe, many players must consider even more factors while developing their LNG procurement strategy to manage risks. RBAC’s G2M2® modeling system has robust scenario planning capability which effectively addresses these uncertainties ahead, and our team has been leveraging this powerful analytical platform to gain a better understanding on the evolving markets.