As LNG trade becomes the fastest-growing segment of global gas and fuels much enthusiasm in investing in LNG facilities, it also presents a new concern to many participants in the market: with many competing LNG projects, do we have an oversupplied LNG market at hand? Two recent news in the past week was particularly interesting illustrating the rising concern:
The U.S. Federal Energy Regulatory Commission (FERC) on Thursday last week (November 21) approved the construction of four proposed liquefied natural gas (LNG) export facilities in Texas totaling about 6.5 billion cubic feet per day (bcfd) of capacity. Three projects are in the Brownsville area – NextDecade Corp’s 3.6-bcfd Rio Grande, Exelon Corp’s 0.8-bcfd Annova LNG Brownsville and Texas LNG’s 0.6-bcfd Brownsville. The fourth, Cheniere Energy Inc’s 1.5-bcfd Corpus Christi Midscale, is in Corpus Christi.
This week, Singaporean gas importer and marketer Pavilion Energy has taken the unusual step of canceling the loading of an LNG cargo from the United States per Reuter’s report. Since slowing down gas demand this winter, there is little room to take extra cargo from US LNG at the moment, while cargos have been settled at deep discounts.
Before running out and panicking about an oversupplied situation, it is important to have a reality check on the LNG balance, and how this would work going forward. So here are some data points and analysis to consider:
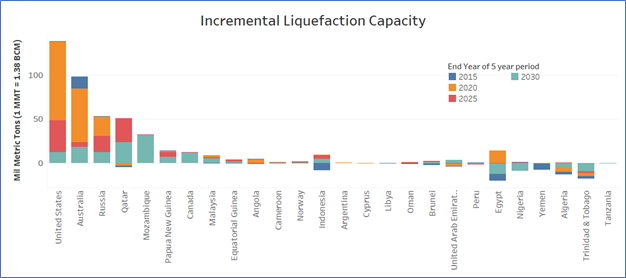
- We are in the middle of one huge wave of LNG liquefaction project additions worldwide, while US has the most incremental capacities. If we aggregate all incremental capacities a total most 400 mmpta, in 5-year blocks, at the country level (see below), almost 45% of the projects are coming online in the period between 2015-2020, while about 30% of that between 2020-2025.
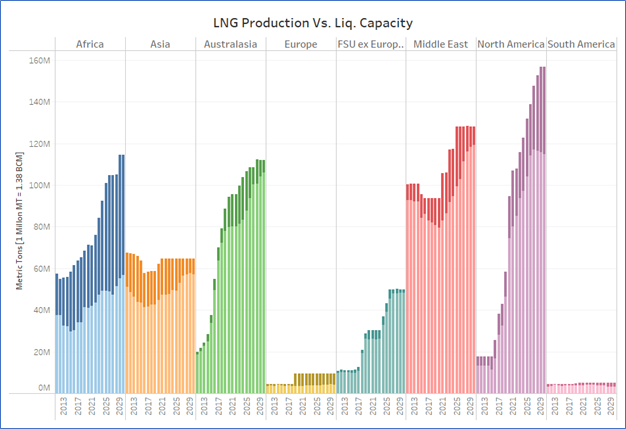
- Furthermore, it is not sufficient if one only looks at the stand-alone basis for capacity addition. With growing demand and increasing numbers of players on both supply and demand side, it is important to consider LNG balance in a robust way, taking into account supply, transportation routes and contracts, and downstream deliverability. Using RBAC’s G2M2® global gas modeling system, we are able to assess the utilization of LNG projects based on possible outcomes in a comprehensive global setting. The chart below we have shown the aggregated LNG utilization against capacity at the regional level.
With the news on canceling cargos, it highlights the complex nature of modeling LNG contract and flows going forward, which is a key feature of G2M2 modeling system. We anticipate more complex and flexible LNG flow patterns as the market evolves. With additional LNG capacities coming online, it is crucial to have a better understanding to screen and select projects for investors and buyers. In the following commentary, we would take a closer look by region to take a look at gas and LNG balance. We would start with North America first: what role does LNG play for North America? So stay tuned.