Concerns about Greenhouse Gas (GHG) emissions, specifically carbon emissions, are not new. They’ve been around for decades with focus really starting in the 1990s, and the Kyoto Protocol which was adopted in 1997. Since that time, a heightened focus on climate change and global warming has commenced and even broadened to now include what is known as ESG, or Environmental, Social and [Corporate] Governance. Most large corporations’ quarterly slide decks now have ESG making up a significant part of these presentations. Another indication of how engrained ESG has become is the compensation metrics for senior executives…ESG metrics are now part of many compensation packages, while production levels metrics have faded.
As this heightened focus has materialized, emissions markets have developed both globally and nationally. Liquidity is increasing as participants from a wide range of industries look to offset their emissions. Examples of these various emissions markets are:
- RGGI – Regional Greenhouse Gas Initiative
- CARB – California Air Resources Board
- EUA – European Union Allowances
These markets offer the trading of allowances to be bought or sold by market participants, including speculators. The allowance holder is provided with an offset to emissions, specifically carbon dioxide (CO2). Market participants who, as part of their business operations (e.g., renewable energy generators), generate emissions less than pre-determine thresholds, earn allowances that they can sell. Conversely, those that generate more emissions than the thresholds need to purchase allowances to get themselves within compliance levels.
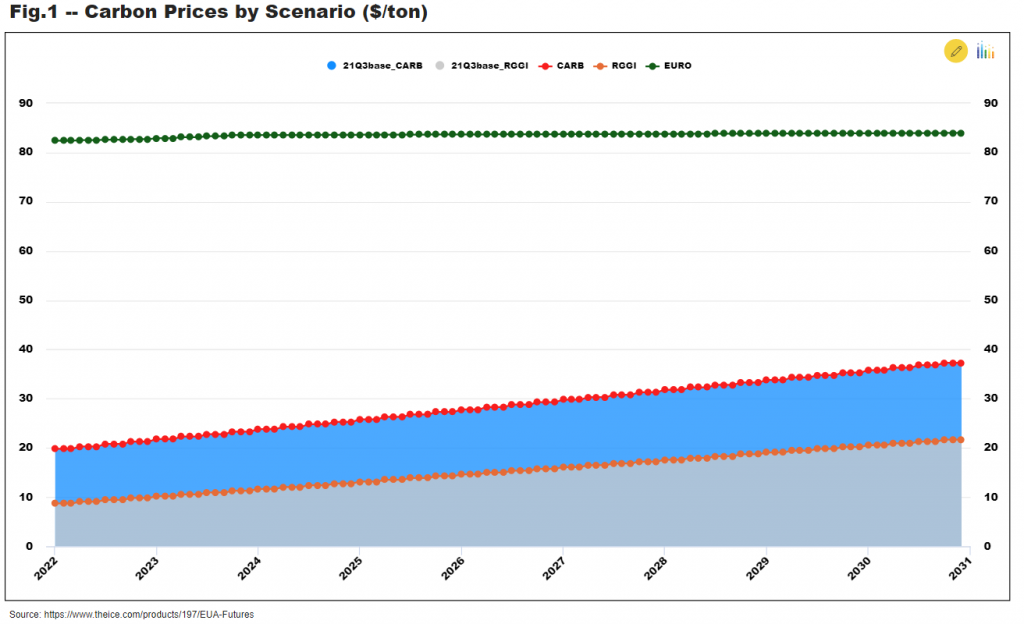
For the purpose of this article and the associated analysis, RGGI, CARB, and EUA are the market prices that will be used to assess the impacts related to North American natural gas supply, demand and prices should a blanket Carbon Mandate be applied to all of US and Canada. Using the GPCM® Market Simulator for North American Gas and LNG™, an analysis was conducted to compare 3 different scenarios vs RBAC’s 21Q3 release that modeled the current US states and Canadian provinces that participate in the RGGI and CARB exchanges:
- RGGI Scenario → RGGI prices applied to the electric power generation sector (ELC) only
- CARB Scenario → CARB prices applied to the industrial (IND), ELC sectors, and upstream/midstream (via lease and plant fuel, LPF)
- EURO Scenario → EUA prices (from ICE settlements on 2Dec21) applied to the industrial (IND), ELC sectors, and upstream/midstream (via lease and plant fuel, LPF)
There’s a significant disparity among these prices with EUA prices being dramatically higher. Even though it’s unlikely that such an abrupt and radical implementation would occur in North America, it does make for an interesting analysis.
Using GPCM, one can create scenarios to simulate aspects of the cost/benefit analysis with respect to market fundamentals. What this analysis shows, is that size (carbon footprint) does matter, but breadth (what industries are targeted/impacted) and magnitude (carbon prices) are also critically important. While we primarily focus on impacts to the ELC and IND sectors, one must keep in mind the impact a nationwide Carbon Mandate would have on commercial (COM) and residential (RES) sectors if implemented across all sectors and the likelihood that low-income households would bear an outsized portion of the burden.
All scenarios focus on the implementation of a carbon mandate for both the US and Canada, but the RGGI scenario is only applicable to the ELC sector while the CARB and EURO scenarios are applicable to IND, LPF and ELC. Mexico was excluded from the carbon mandate given their less stable government and policies. The scenarios were run from January 2022 through December 2030 to keep the focus on the “mid-term” impacts, with the carbon mandate being implemented right at the start, i.e., January 2022. Lastly, the scenarios were run using only GPCM, so there were no iterations with RBAC’s G2M2® Market Simulator for Global Gas and LNG™ and thus any price elasticity related to LNG exports demand was not simulated – this would be a worthwhile set of scenarios to evaluate…stay tuned.
Thinking back to Econ101, one would expect that higher input prices will lead to lower demand in the impacted sectors. As demand from the impacted sectors declines, this feeds back into prices as a new supply/demand equilibrium is attained. So, let’s first examine what happens with demand across the 3 scenarios.
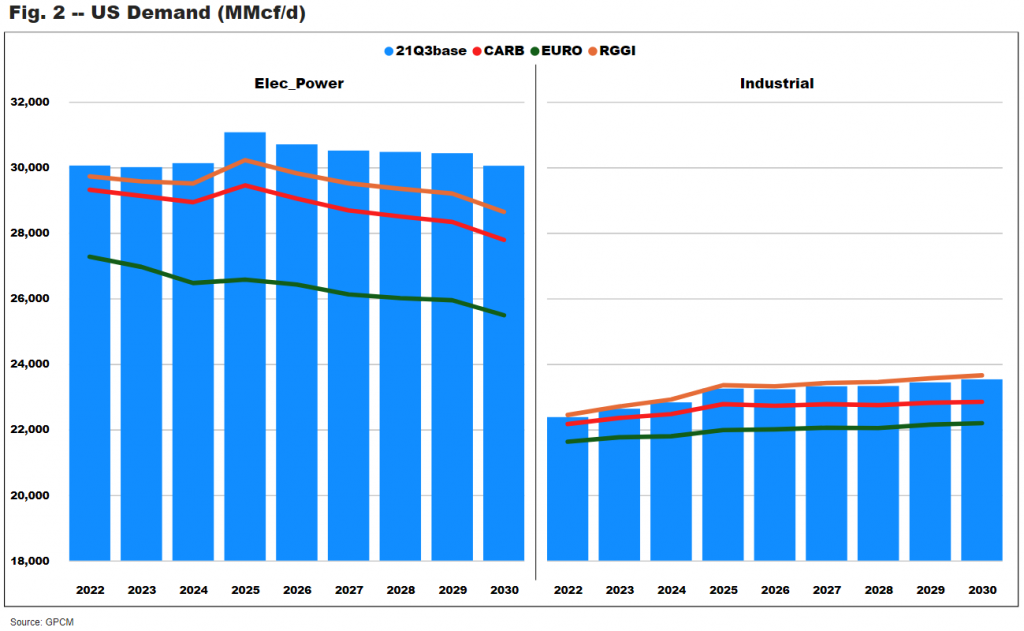
As expected, US demand in the ELC sector declines across all 3 scenarios. The carbon “tax” on gas fired power generation raises the fuel cost which lowers demand, with the largest impact unsurprisingly coming from the EURO scenario – referring back to Fig. 1 above, one can see that CO2 prices are much higher in this scenario. Keep in mind that a carbon tax would also impact coal-based power generation as well as any other fossil fuel-based generation. As such, an implicit assumption in these scenarios is that renewables and/or nuclear power generation will fill any voids. GPCM currently has the capability to integrate with power models and uses an optimization algorithm to ensure acceptable convergence, quickly – run times are always an issue on the power modeling side. Furthermore, RBAC’s G2M2 simulator currently uses a logistic regression model to forecast market share by fuel type and that model will be integrated into GPCM in 2022.
Shifting focus to the IND sector, what is interesting is gas demand is lower in both the CARB and EURO scenarios but is actually marginally higher in the RGGI scenario. The reason for this is that, in the RGGI scenario, only the ELC sector is hit with the carbon tax and so as prices decline due to lower ELC demand, IND demand increases. Again, reaching back in the Econ 101 memory bank, recall that term “elasticity”? Well, GPCM, being a market simulator, accounts for such real-world occurrences, and that is what is happening here.
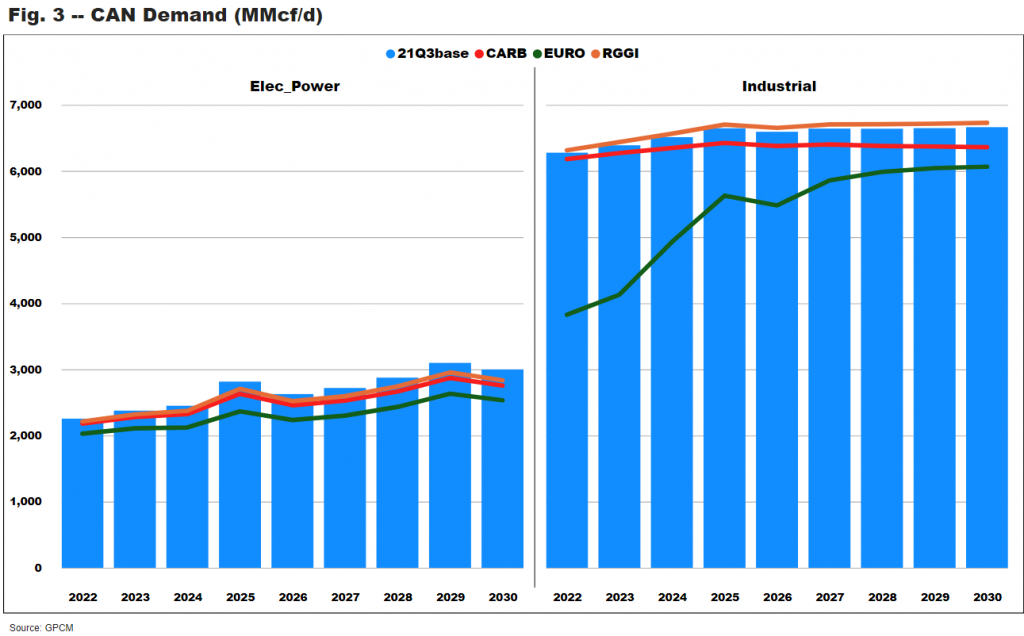
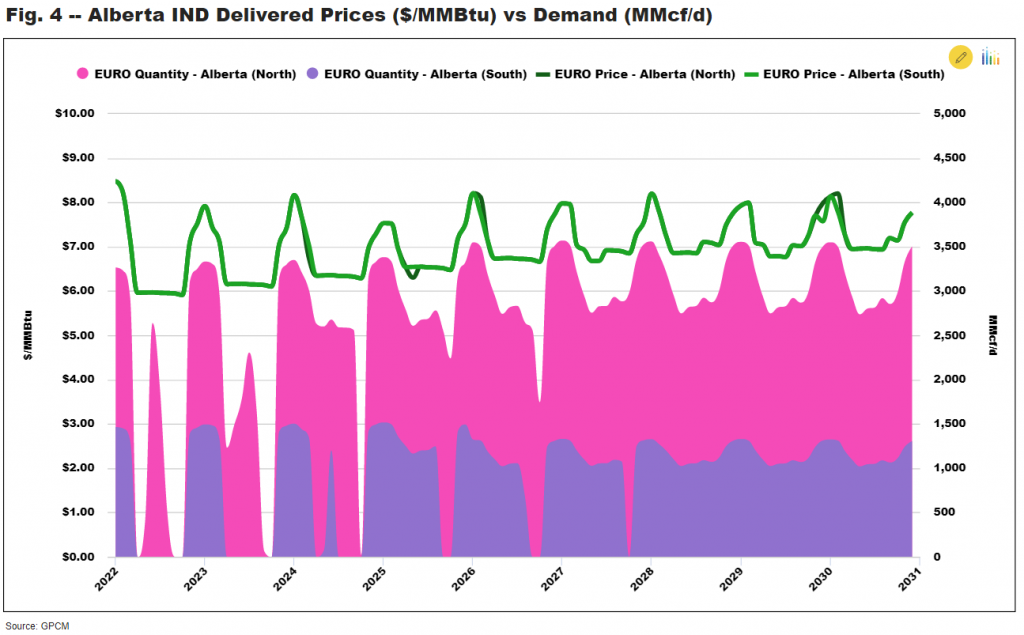
When performing this analysis, we noticed an anomaly in our EURO scenario with respect to Canadian IND demand. In certain instances, IND demand drops to zero due to the impact of carbon pricing, meaning that the additional regulatory cost made it uneconomical to operate. GPCM’s database and assumptions are extremely granular, which is needed in order to simulate the real world. As such, demand curves and the associated elasticities are developed at a customer, sector, location, and monthly level. Users have full capability to modify these demand curves and elasticities. However, the current assumptions specific to IND sector demand in Alberta are structured such that prices of approximately $6.00/MMBtu, delivered to IND customers during summer months, are in excess of the demand curve’s upper bound. In such situations, it is more economical for Alberta IND customers to either switch to alternative fuels, if possible, or shut down gas consuming operations.
These situations occur in several summer months through 2027, though with less frequency. The demand curve upper bounds increase over time and by 2028 they are high enough to allow for demand to be met for delivered prices approaching $7.00/MMBtu. This explains the increasing slope for IND demand in Fig. 3 above. Again, users can easily change these assumptions, but it is an interesting situation seen in the EURO scenario. If the goal is to target specific industries and impede operations of those deemed major contributors to unhealthy climate, then the EURO scenario might be a carbon price that gets the job done.
Implementing policies that impact demand also leads to impacts on prices and thus supply. Focusing on the 3 major basin groups in the US and the 1 major basin in Canada, one can see that the brunt of supply impact is attributed to the Appalachia basin and all basins are negatively impacted. This makes sense as all scenarios result in lower total demand, so less supply is called upon in a lower price environment vs RBAC’s 21Q3 release.
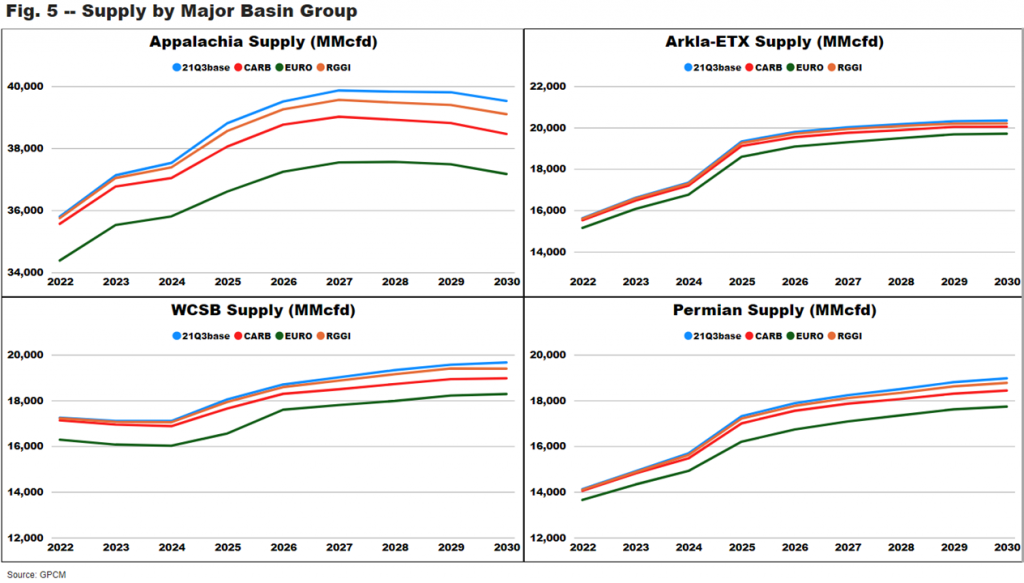
Appalachia gas supply is facing an increasingly difficult environment as regulations are making infrastructure expansion more challenging. This is limiting the basin’s production gains and making it more dependent on indigenous demand. Consequently, running scenarios that dramatically and negatively impact local demand results in significant supply reductions. There’s just much less optionality for Appalachian supply. Permian, and to a lesser extent Arkla-ETX (think Haynesville), do experience negative supply impacts but both are in more favorable proximity to capture the increased Mexico demand, which benefits from lower prices and no applicable carbon mandate. With lower demand in western Canada and the US Northeast, WCSB production declines significantly. Using RBAC’s Visual Analytics Add-on service, subscribers could easily vet flow change patterns across the various scenarios. Within GPCM, users can also access the GDS (Graphical Display System) to conduct similar analyses.
Two of the 3 carbon scenarios show significant changes in Henry Hub prices, with the CARB scenario showing between a $0.40 – $0.50/MMBtu decline throughout the forecast period. The EURO is even more dramatic with prices initially nearly $2.00/MMBtu lower before starting to converge back to only $0.40/MMBtu lower by the end of the forecast. It was noted above that no iteration between GPCM and G2M2 were conducted for this analysis, but it would be worthwhile to see how LNG export demand might be impacted in this lower price environment.
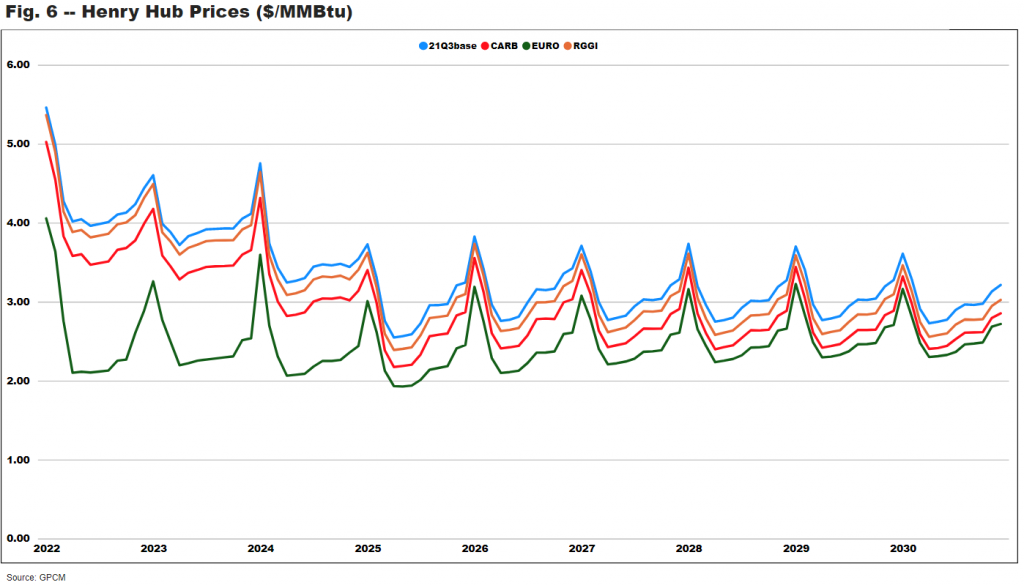
The focus though should not only be on Henry Hub prices, especially since the impact of carbon prices are directed towards end-use markets. It’s worth scrolling back up to again look at the Alberta IND delivered price vs quantity chart (Fig. 4) to recall that much higher prices resulting from the EURO scenario can have tremendous effects on demand. It is this demand shedding that directly impacts other prices like Henry Hub.
The goal of these scenarios is to demonstrate GPCM’s capabilities to simulate varying assumptions related to carbon pricing and potential mandates. RGGI and CARB are already active markets and impact various states that have elected to participate in these GHG policies. Without doubt, the political and regulatory climate is a moving target, and it is possible, maybe even likely, that the pendulum will swing more dramatically over the next few years as mid-term elections occur in 2022 and the presidential election in 2024. Current evidence of this can be seen as states are looking to both enter or exit such programs – e.g., PA to join RGGI and VA considering an exit.
RBAC continues to develop real world market simulators to help industry model and analyze the implications of varying regulatory as well as market fundamental assumptions, both globally and domestically (i.e., North America). This article and the underlying scenarios only scratch the surface of the capabilities and output that users can tap into with respect to growing carbon/ESG concerns.
Please feel free to contact us with your market simulation needs.
Scott McKenna, Director of Global Energy Analysis
Robert Kachamr, Senior Analyst
© 2021 RBAC, Inc. All rights reserved. GPCM, GPCM Market Simulator for North American Gas and LNG, G2M2 and G2M2 Market Simulator for Global Gas and LNG are trademarks of RT7K, LLC and are used with its permission.