South Korea is now known as a highly developed economy with a hand in a variety of industries such as electronics, automobiles, telecommunications, chemicals, steel, and shipbuilding.1 However, one of the largest economies in the world by GDP was not always such an economic powerhouse. How exactly was South Korea able to rapidly grow their economy and what fuels powered this transformation that came to be known as the “Miracle on the Han River”?
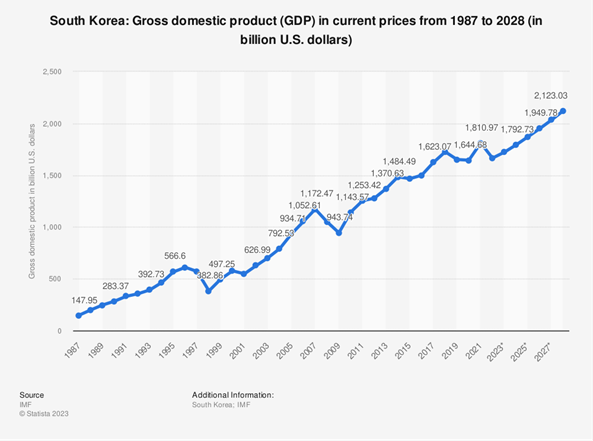
Figure 1, South Korea: Gross domestic product (GDP) in current prices from 1987 to 2028. Source: IMF and Statista
Miracle on the Han River
This refers to the rapid economic growth that directly followed the Korean War. At this time their economy was primarily agricultural, however this would change in 1961 when then general Park Chung-hee rose to power after leading a coup against the Democratic Party. He would go on to implement numerous economic reforms which later served as the foundation for future growth. The first “Five-Year Plan” was put into action which expanded the agricultural industry, energy industries such as coal and electricity, and the construction of transportation infrastructure such as roads, railways, and ports.2 In 1970, South Korea launched the Saemaeul movement which was intended to spur development of rural areas within the country by creating guidelines that rural areas could follow that would help to improve their basic living conditions.3 From 1972 to 1981, the electronics and steel industries were expanding due to increasing investment by their government and by 1995 South Korea had established itself as one of the largest economies in the world.
South Korea’s Energy Mix
During their economic overhaul, South Korea was primarily powered by an even mix of coal and oil which were effectively the two sources of energy within the country until the implementation of nuclear in 1977. As heavy industries such as electronics and steel saw rapid expansion from the 1970’s to 1980’s, expansion in energy consumption also followed.
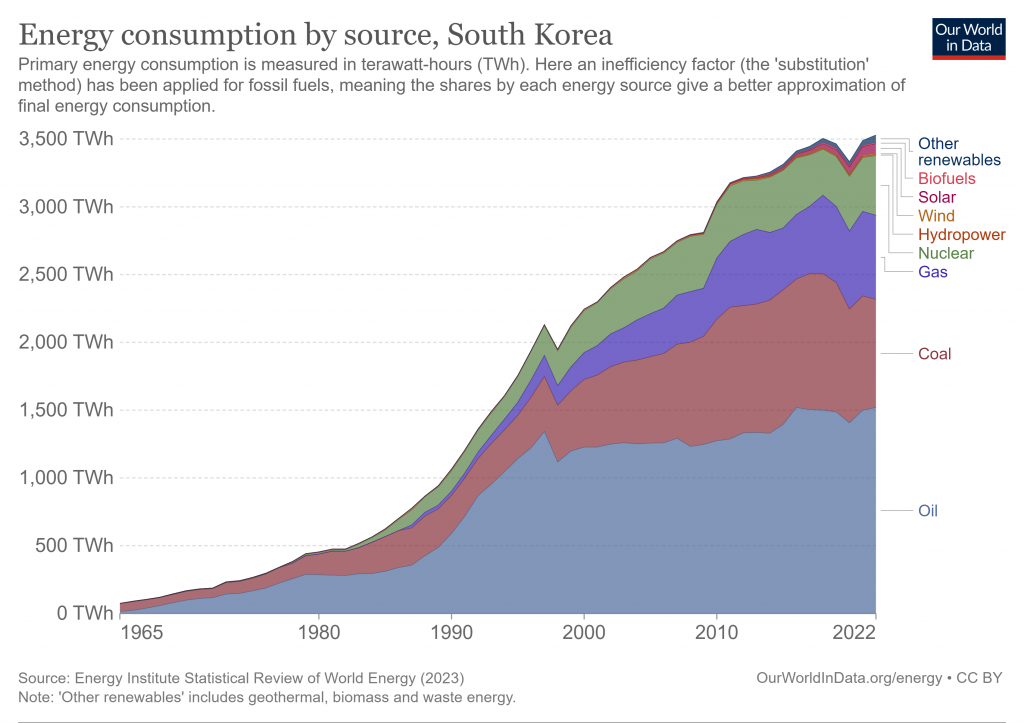
Figure 2, Energy consumption by source, South Korea. Source: Energy Institute Statistical Review of World Energy and Our World in Data
Between 1975 and 1985, the trio of coal, oil and nuclear served as the energy that powered the country. The following year is when natural gas was introduced into South Korea’s energy mix, which much like nuclear, saw a fast implementation into their ecosystem.
Overtime as South Korea continued to grow the role of nuclear and natural gas kept expanding while coal and oil were quickly falling out of favor.
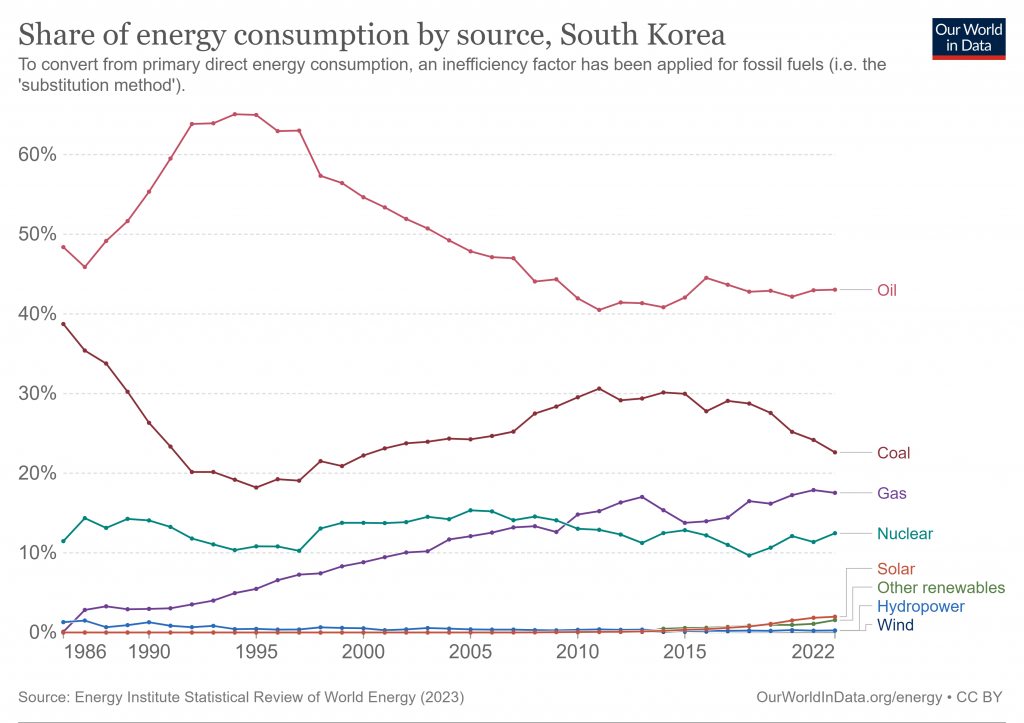
Figure 3, Share of energy consumption by source, South Korea. Source: Energy Institute Statistical Review of World Energy and Our World in Data
When natural gas was initially introduced the share of each energy source was 48.38% (338.90 TWh) for oil, 38.74% for coal (271.33 TWh), 11.47% (80.33 TWh) for nuclear, and 0.10% for natural gas (0.71 TWh). Today these numbers have shifted to 43.04% (1,519.42 TWh) for oil, 22.62% (798.56 TWh) for coal, 17.54% (619.28 TWh) for natural gas, and 12.48% (440.45 TWh) for nuclear. Other sources such as hydropower, solar and wind also are responsible for providing energy to the country, but their contribution is minimal by comparison. Overall, energy consumption has increased from 700.47 TWh in 1986 to 3,530.01 TWh which is a result of massive economic and industrial reforms that took place in the decades after the war.
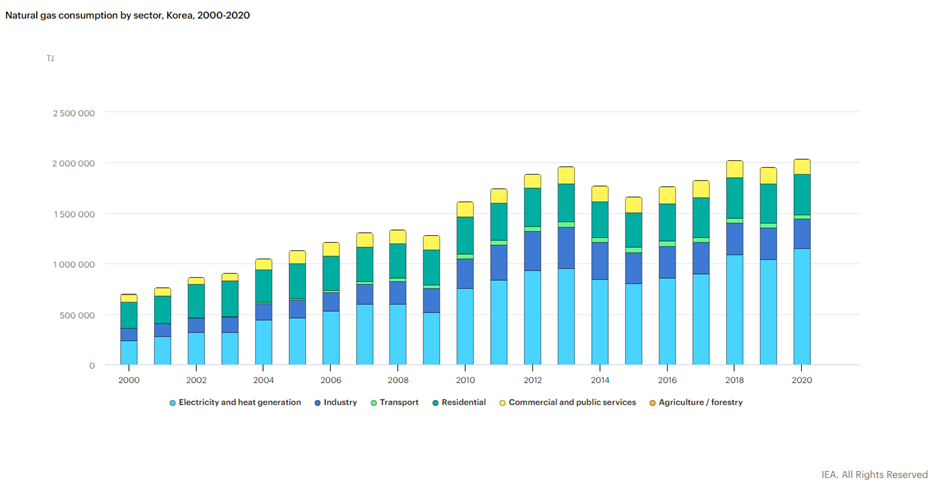
Figure 4, Natural gas consumption by sector, Korea, 2000-2020. Source: IEA
South Korea’s Relationship with LNG
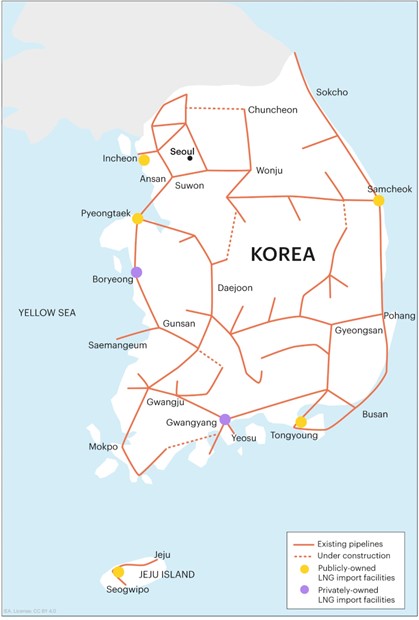
South Korea has minimal reserves of natural gas within the country and has no pipelines which they can import gas from so their only option is to import LNG.
Figure 5, South Korea's Natural Gas Infrastructure in 2022. Source: IEA
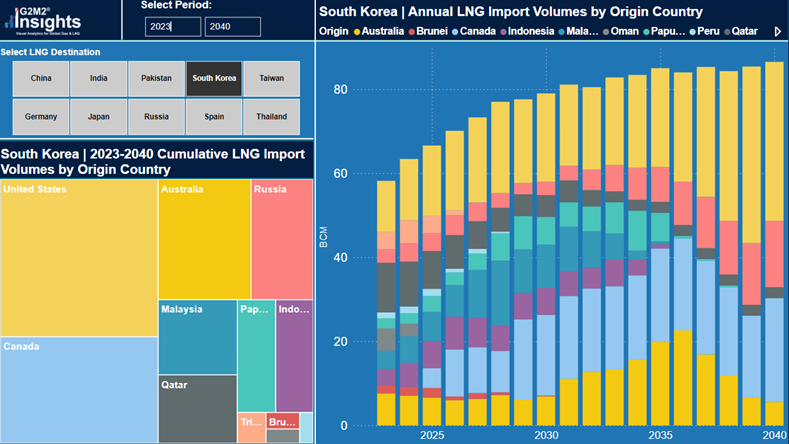
They are one of the largest importers of LNG in world, with 57.9 bcm of LNG being imported in 2023. The top supplier of LNG to South Korea is currently the United States, but as more export projects reach FID in Canada, they may soon contest the United States for supply contracts.4
Figure 6, South Korea Annual LNG Import Volumes 20203-2040. Source: G2M2 Insights
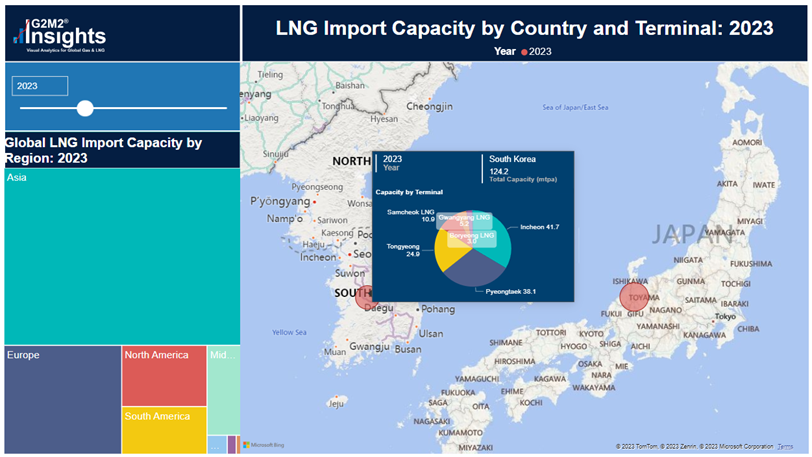
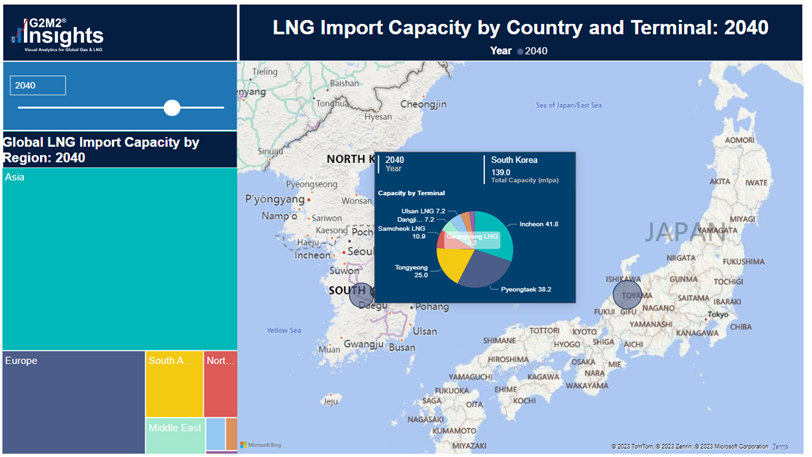
With increased amounts of LNG being imported, more import capacity will be required. In 2023, their import capacity is currently 124.2 mtpa and is expected to grow to 139 mtpa by 2040.
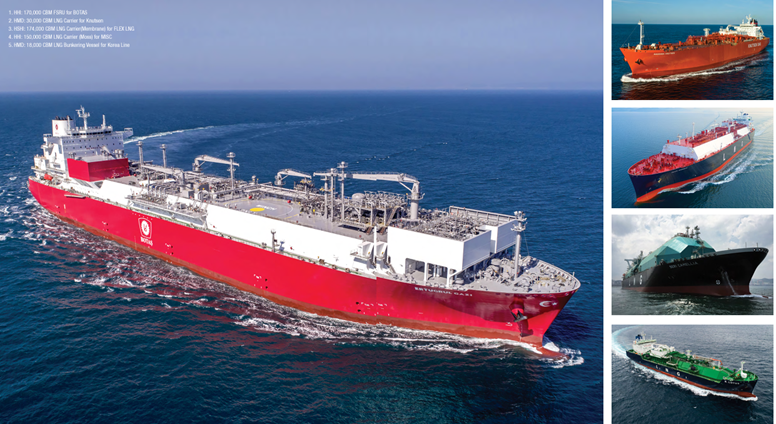
In addition to being an importer of LNG, South Korea’s famous shipyards are also responsible for the construction of the vessels that transport LNG around the world.5 With QatarEnergy increasing their LNG production, they have signed contracts with three shipyards, Hyundai Heavy Industries, Samsung Heavy Industries, and Hanwha Ocean for 77 new LNG vessels.
Figure 8, LNG Carriers from Hyundai Heavy Industries. Source: Hyundai Heavy Industries.
The Green New Deal
In 2022, newly elected South Korean President, Yoon Suk-yeol unveiled a new plan which aimed to reduce reliance on fossil fuels and increase oil and LNG storage capacity.6 South Korea plans to further increase the share of nuclear in their energy mix to 30% by 2030. They also plan to increase LNG storage capacity to 18.4 million kiloliters by 2034 from 13.69 today. In addition to increasing LNG storage, aging coal-fired power plants are going to be replaced by new LNG-based generators. “24 of the 30 coal plants scheduled for closure by 2034 are planned to be adapted to run on gas instead of being shut down or replaced by facilities using renewables.”7
There has often been debate within the energy industry on the increasing penetration of renewable energy in the market. Some say the energy transition is happening too quicky and its goals are unrealistic whole others say it is not happening fast enough and more investment needs to be made.8 President Yoon Suk-yeol believes that, “100 percent renewable energy by 2050, is impossible to achieve, as the demand for energy cannot be sufficiently met with eco-friendly energy sources.”9This belief is evident in his energy policy reform. While it is important to maintain climate health, it is also important that sources of energy are both reliable and available when it is needed.
Our goal at RBAC is to help ensure that decisions regarding energy from both an industry and government standpoint are made with all available information and understanding the impacts of these decisions through market simulation. The G2M2® Market Simulator for Global Gas and LNG™ can be used to understand the long-term effects of natural gas and LNG related projects or changes to policy and to better understand the global gas and LNG market as a whole.
RBAC, Inc. has been the leading provider of market fundamental analysis tools used by the energy industry and related government agencies for over two decades. The GPCM® Market Simulator for North American Gas and LNG™ is the most widely used natural gas market modeling system in North America. RBAC’s G2M2® Market Simulator for Global Gas and LNG™ has been instrumental in understanding evolving global gas and LNG dynamics and is vital in fully understanding the interrelationship between the North American and global gas markets.